Last active
February 12, 2025 21:26
-
-
Save thelastpointer/c52c4b1f147dc47961798e39e3a7ea10 to your computer and use it in GitHub Desktop.
Draw graphs in OnInspectorGUI. #unity3d
This file contains hidden or bidirectional Unicode text that may be interpreted or compiled differently than what appears below. To review, open the file in an editor that reveals hidden Unicode characters.
Learn more about bidirectional Unicode characters
| /* | |
| EditorGraph -- quickly draw graphs in the inspector. | |
| Place this in a folder named 'Editor'. | |
| */ | |
| /* | |
| USAGE: | |
| public override void OnInspectorGUI() | |
| { | |
| base.OnInspectorGUI(); | |
| TLP.Editor.EditorGraph graph = new TLP.Editor.EditorGraph(0, -1, 10, 1, "Just a sin wave", 100); | |
| graph.AddFunction(x => Mathf.Sin(x)); | |
| graph.Draw(); | |
| } | |
| MORE COMPLICATED USAGE: | |
| public override void OnInspectorGUI() | |
| { | |
| base.OnInspectorGUI(); | |
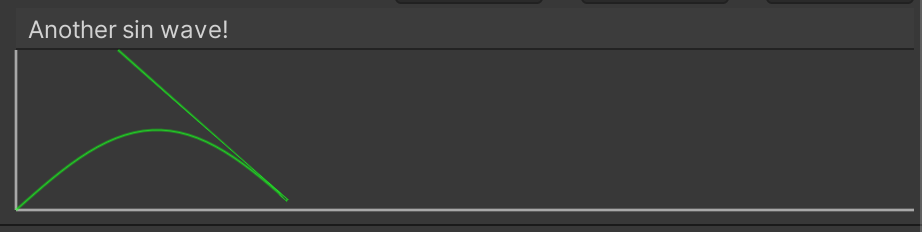
| TLP.Editor.EditorGraph graph = new TLP.Editor.EditorGraph(0, -1, 10, 1, "Another sin wave!", 100); | |
| graph.AddFunction(x => Mathf.Sin(x)); | |
| // Another function with a different color | |
| graph.AddFunction(x => Mathf.Sin(x * 2), Color.cyan); | |
| // Do something when the graph is clicked on | |
| graph.AddClickEvent((x, y) => Debug.LogFormat("You clicked at {0};{1}. The sin value for that is {2}", x, y, Mathf.Sin(x))); | |
| // Edit some colors... | |
| graph.Colors.Background = new Color(0.2f, 0.2f, 0.2f, 1f); | |
| // Add two vertical lines | |
| graph.AddLineX(Mathf.PI); | |
| graph.AddLineX(Mathf.PI * 2); | |
| // Add a horizontal line with different color | |
| graph.AddLineY(0, Color.gray); | |
| graph.Draw(); | |
| } | |
| */ | |
| using UnityEngine; | |
| using UnityEditor; | |
| using System.Collections.Generic; | |
| namespace TLP.Editor | |
| { | |
| /// <summary> | |
| /// Draw graphs in the inspector. | |
| /// </summary> | |
| public class EditorGraph | |
| { | |
| /// <summary> | |
| /// Title of the graph. | |
| /// </summary> | |
| public string Title; | |
| /// <summary> | |
| /// Vertical helper line distance, in graph units (a vertical line will be drawn every X units, starting at minimum X). Set 0 to disable. | |
| /// </summary> | |
| /// <remarks>There will be at most one line per every two pixels.</remarks> | |
| public float GridLinesX = 0; | |
| /// <summary> | |
| /// Horizontal helper line distance, in graph units (a horizontal line will be drawn every Y units, starting at minimum Y). Set 0 to disable. | |
| /// </summary> | |
| /// <remarks>There will be at most one line per every two pixels.</remarks> | |
| public float GridLinesY = 0; | |
| /// <summary> | |
| /// Color settings. | |
| /// </summary> | |
| public GraphColors Colors; | |
| /// <summary> | |
| /// Resolution of the graph -- how many points are evaluated and rendered for custom functions. | |
| /// </summary> | |
| public int GraphResolution = 48; | |
| /// <summary> | |
| /// Constructor. | |
| /// </summary> | |
| /// <param name="_minX">Minimum X value in graph units.</param> | |
| /// <param name="_minY">Minimum Y value in graph units.</param> | |
| /// <param name="_maxX">Maximum X value in graph units.</param> | |
| /// <param name="_maxY">Maximum Y value in graph units.</param> | |
| /// <param name="_title">Title of the graph (optional).</param> | |
| /// <param name="_title">Resolution of the graphs (how many points are evaluated for each custom function).</param> | |
| public EditorGraph(float _minX, float _minY, float _maxX, float _maxY, string _title = "", int _resolution = 48) | |
| { | |
| if (_minX >= _maxX) | |
| throw new System.ArgumentException("Editor graph: minimum X value must be greater than maximum!", "_minX"); | |
| if (_minY >= _maxY) | |
| throw new System.ArgumentException("Editor graph: minimum Y value must be greater than maximum!", "_minY"); | |
| minX = _minX; | |
| maxX = _maxX; | |
| minY = _minY; | |
| maxY = _maxY; | |
| rangeX = maxX - minX; | |
| rangeY = maxY - minY; | |
| Title = _title; | |
| GraphResolution = _resolution; | |
| // Default graph colors | |
| Colors = new GraphColors | |
| { | |
| Background = new Color(0.15f, 0.15f, 0.15f, 1f), | |
| Outline = new Color(0.15f, 0.15f, 0.15f, 1f), | |
| GridLine = new Color(0.5f, 0.5f, 0.5f), | |
| Function = Color.red, | |
| CustomLine = Color.white | |
| }; | |
| } | |
| /// <summary> | |
| /// Colors used to draw the graph. | |
| /// </summary> | |
| public struct GraphColors | |
| { | |
| /// <summary> | |
| /// Background color. | |
| /// </summary> | |
| public Color Background; | |
| /// <summary> | |
| /// Outline color for the graph. | |
| /// </summary> | |
| public Color Outline; | |
| /// <summary> | |
| /// Helper line color. | |
| /// </summary> | |
| public Color GridLine; | |
| /// <summary> | |
| /// Default color for custom functions. | |
| /// </summary> | |
| public Color Function; | |
| /// <summary> | |
| /// Default color for custom lines. | |
| /// </summary> | |
| public Color CustomLine; | |
| } | |
| #region Public functions | |
| /// <summary> | |
| /// Draw the graph with the default size (128x80). | |
| /// </summary> | |
| public void Draw() | |
| { | |
| Draw(128, 80); | |
| } | |
| /// <summary> | |
| /// Draw the graph with the specified minimum size. | |
| /// </summary> | |
| /// <param name="width">Minimum width of the graph in pixels.</param> | |
| /// <param name="height">Minimum height of the graph in pixels.</param> | |
| public void Draw(float width, float height) | |
| { | |
| // Get rect | |
| if (!string.IsNullOrEmpty(Title)) | |
| { | |
| using (new GUILayout.HorizontalScope(EditorStyles.toolbar)) | |
| GUILayout.Label(Title); | |
| } | |
| // Title | |
| using (new GUILayout.HorizontalScope()) | |
| { | |
| GUILayout.Space(EditorGUI.indentLevel * 15f); | |
| rect = GUILayoutUtility.GetRect(width, height); | |
| } | |
| // Handle MouseDown events | |
| if (Event.current.type == EventType.MouseDown) | |
| { | |
| if (rect.Contains(Event.current.mousePosition)) | |
| { | |
| Vector2 mousePos = (Event.current.mousePosition - rect.position); | |
| Vector2 unitPos = new Vector2( | |
| mousePos.x / rect.width * rangeX + minX, | |
| (1f - (mousePos.y / rect.height)) * rangeY + minY | |
| ); | |
| foreach (var e in clickEvents) | |
| e(unitPos.x, unitPos.y); | |
| } | |
| } | |
| // Only continue if we're repainting the graph | |
| if (Event.current.type != EventType.Repaint) | |
| return; | |
| // Background | |
| DrawRect(minX, minY, maxX, maxY, Colors.Background, Colors.Outline); | |
| // Vertical helper lines | |
| if (GridLinesX > 0) | |
| { | |
| float multiplier = 1; | |
| while ((rangeX / (GridLinesX * multiplier)) > (rect.width / 2f)) | |
| multiplier *= 2; | |
| for (float x = minX; x <= maxX; x += GridLinesX * multiplier) | |
| DrawLine(x, minY, x, maxY, Colors.GridLine, 1); | |
| } | |
| // Horizontal helper lines | |
| if (GridLinesY > 0) | |
| { | |
| float multiplier = 1; | |
| while ((rangeY / (GridLinesY * multiplier)) > (rect.height / 2f)) | |
| multiplier *= 2; | |
| for (float y = minY; y <= maxY; y += GridLinesY * multiplier) | |
| DrawLine(minX, y, maxX, y, Colors.GridLine, 1); | |
| } | |
| // Vertical lines | |
| foreach (var line in linesX) | |
| { | |
| DrawLine(line.Position, minY, line.Position, maxY, line.Color, 2); | |
| } | |
| // Horizontal lines | |
| foreach (var line in linesY) | |
| { | |
| DrawLine(minX, line.Position, maxX, line.Position, line.Color, 2); | |
| } | |
| // Check if the vertex buffer is of the correct size | |
| int res = (GraphResolution <= 0 ? 48 : GraphResolution); | |
| if ((curveVertices == null) || (curveVertices.Length != res)) | |
| curveVertices = new Vector3[res]; | |
| // Evaluate all functions | |
| foreach (var func in functions) | |
| { | |
| var vcount = 0; | |
| while (vcount < res) | |
| { | |
| var x = this.rangeX * vcount / (res - 1); | |
| var y = func.Function(x); | |
| curveVertices[vcount++] = UnitToGraph(x, y); | |
| } | |
| if (vcount > 1) | |
| { | |
| Handles.color = func.Color; | |
| Handles.DrawAAPolyLine(2.0f, vcount, curveVertices); | |
| } | |
| } | |
| } | |
| /// <summary> | |
| /// Add a custom function to the graph using the default color. | |
| /// </summary> | |
| /// <param name="func">A function that evaluates the graph at a given position (graph units).</param> | |
| public void AddFunction(GraphFunction func) | |
| { | |
| AddFunction(func, Colors.Function); | |
| } | |
| /// <summary> | |
| /// Add a custom function to the graph. | |
| /// </summary> | |
| /// <param name="func">A function that evaluates the graph at a given position (graph units).</param> | |
| /// <param name="color">Color of the rendered function.</param> | |
| public void AddFunction(GraphFunction func, Color color) | |
| { | |
| foreach (var pair in functions) | |
| { | |
| if (pair.Function == func) | |
| return; | |
| } | |
| functions.Add(new FunctionColorPair { Function = func, Color = color }); | |
| } | |
| /// <summary> | |
| /// Register a function that handles click events. Arguments are passed as graph units. | |
| /// </summary> | |
| /// <param name="e">Function to call when the user clicks on the graph.</param> | |
| public void AddClickEvent(MouseEvent e) | |
| { | |
| if (!clickEvents.Contains(e)) | |
| clickEvents.Add(e); | |
| } | |
| /// <summary> | |
| /// Add a vertical line with the default color. | |
| /// </summary> | |
| /// <param name="value">Position of the line in graph units.</param> | |
| public void AddLineX(float value) | |
| { | |
| AddLineX(value, Colors.CustomLine); | |
| } | |
| /// <summary> | |
| /// Add a vertical line. | |
| /// </summary> | |
| /// <param name="value">Position of the line in graph units.</param> | |
| /// <param name="color">Color of the line.</param> | |
| public void AddLineX(float value, Color color) | |
| { | |
| foreach (var pair in linesX) | |
| { | |
| if (pair.Position == value) | |
| return; | |
| } | |
| linesX.Add(new LineColorPair { Position = value, Color = color }); | |
| } | |
| /// <summary> | |
| /// Add a horizontal line with the default color. | |
| /// </summary> | |
| /// <param name="value">Position of the line in graph units.</param> | |
| public void AddLineY(float value) | |
| { | |
| AddLineY(value, Colors.CustomLine); | |
| } | |
| /// <summary> | |
| /// Add a horizontal line. | |
| /// </summary> | |
| /// <param name="value">Position of the line in graph units.</param> | |
| /// <param name="color">Color of the line.</param> | |
| public void AddLineY(float value, Color color) | |
| { | |
| foreach (var pair in linesY) | |
| { | |
| if (pair.Position == value) | |
| return; | |
| } | |
| linesY.Add(new LineColorPair { Position = value, Color = color }); | |
| } | |
| #endregion | |
| /// <summary> | |
| /// Custom function delegate. This works in graph units. | |
| /// </summary> | |
| /// <param name="x">Input value, eg. where the function is evaluated.</param> | |
| /// <returns>The evaluated value at position x.</returns> | |
| public delegate float GraphFunction(float x); | |
| /// <summary> | |
| /// Mouse click delegate. | |
| /// </summary> | |
| /// <param name="x">X position of the click, in graph units.</param> | |
| /// <param name="y">Y position of the click, in graph units.</param> | |
| public delegate void MouseEvent(float x, float y); | |
| #region Internal state | |
| // Vertex buffers | |
| Vector3[] rectVertices = new Vector3[4]; | |
| Vector3[] lineVertices = new Vector3[2]; | |
| Vector3[] curveVertices; | |
| List<FunctionColorPair> functions = new List<FunctionColorPair>(); | |
| List<LineColorPair> linesX = new List<LineColorPair>(); | |
| List<LineColorPair> linesY = new List<LineColorPair>(); | |
| List<MouseEvent> clickEvents = new List<MouseEvent>(); | |
| float minX, maxX, minY, maxY; | |
| Rect rect; | |
| float rangeX = 10; | |
| float rangeY = 10; | |
| struct FunctionColorPair | |
| { | |
| public GraphFunction Function; | |
| public Color Color; | |
| } | |
| struct LineColorPair | |
| { | |
| public float Position; | |
| public Color Color; | |
| } | |
| #endregion | |
| #region Helper functions | |
| Vector3 UnitToGraph(float x, float y) | |
| { | |
| x = Mathf.Lerp(rect.x, rect.xMax, (x - minX) / rangeX); | |
| y = Mathf.Lerp(rect.yMax, rect.y, (y - minY) / rangeY); | |
| return new Vector3(x, y, 0); | |
| } | |
| float UnitToGraphX(float x) | |
| { | |
| return Mathf.Lerp(rect.x, rect.xMax, (x - minX) / rangeX); | |
| } | |
| float UnitToGraphY(float y) | |
| { | |
| return Mathf.Lerp(rect.yMax, rect.y, (y - minY) / rangeY); | |
| } | |
| void DrawLine(float x1, float y1, float x2, float y2, Color color, float width) | |
| { | |
| lineVertices[0] = UnitToGraph(x1, y1); | |
| lineVertices[1] = UnitToGraph(x2, y2); | |
| Handles.color = color; | |
| Handles.DrawAAPolyLine(width, lineVertices); | |
| } | |
| void DrawRect(float x1, float y1, float x2, float y2, Color fill, Color line) | |
| { | |
| rectVertices[0] = UnitToGraph(x1, y1); | |
| rectVertices[1] = UnitToGraph(x2, y1); | |
| rectVertices[2] = UnitToGraph(x2, y2); | |
| rectVertices[3] = UnitToGraph(x1, y2); | |
| Handles.DrawSolidRectangleWithOutline(rectVertices, fill, line); | |
| } | |
| #endregion | |
| } | |
| } |
Author
Awesome!! I haven't looked through everything, but when I tried to draw Mathf.Cos(x) it would be blank. Changed line 242 to:
`if ((y >= minY) && (y <= maxY))`
Maybe that was a bad idea, but working for me now, great work!!
Author
@AardvarksUpInYoFace Nice catch! I updated the gist, thank you :)
For some reason if I set the minY to 0. The graph becomes unexpected.
    TLP.Editor.EditorGraph graph = new TLP.Editor.EditorGraph(0f, 0f, 10f, 2f, "Another sin wave!", 100);
    graph.AddFunction(x => Mathf.Sin(x));
    graph.AddLineY(0, Color.white);
    graph.AddLineX(0, Color.white);
    graph.Draw();
With some slight alterations, you can also make a bar graph.
List<LineColorBarPair> barX = new List<LineColorBarPair>();

struct LineColorBarPair
{
    public float Width;
    public float Position;
    public float Height;
    public Color Color;
}

public void AddLineX(float value, float height, float width, Color color)
{
    foreach (var pair in barX)
    {
        if (pair.Position == value)
            return;
    }

    barX.Add(new LineColorBarPair
    {
        Position = value,
        Height = height,
        Width = width,
        Color = color
    });
}

foreach (var line in barX)
{
    DrawLine(line.Position, minY, line.Position, line.Height, line.Color, line.Width);
}
Author
Took my sweet time, but I fixed @docchang 's issue. Thank you! Better late than never...
Sign up for free
to join this conversation on GitHub.
Already have an account?
Sign in to comment
Hopefully this script makes it easier to create better and more useful custom inspectors for your classes. Unity3d only.
This is the result of the usage examples: