Inspired by a heise post I found MQTT connectivity for the Ikea VINDRIKTNING and bought 2 of those devices from IKEA.
I followed Hypfer's description with the hardware modification, leaving the fan in it's original wiring for now. The firmware is based on the code of that project as well, however, I had no use for WiFiManager.h and HASS autoconfig so I stripped that off. But the core, reading from the sensor, is just like it was.
Running the 2 sensors side by side I see them return values with an offset of 12, 13 points. I was surprised about the readings, the values seemed quite high compared to what I saw before from another particle sensor.
Since I have an SDS011 sensor running here in a luftdaten.info - setup I was curious as to how the measurements of these sensors compare.
All 3 sensors are outside of a 3rd floor apartment in south-western inner city Berlin. The SDS011 is facing ESE while the vindriktning sensors face to the other side, WNW. SDS011 gives readings for both pm10 and pm25 while vindriktning only gives readings labled to be pm25.
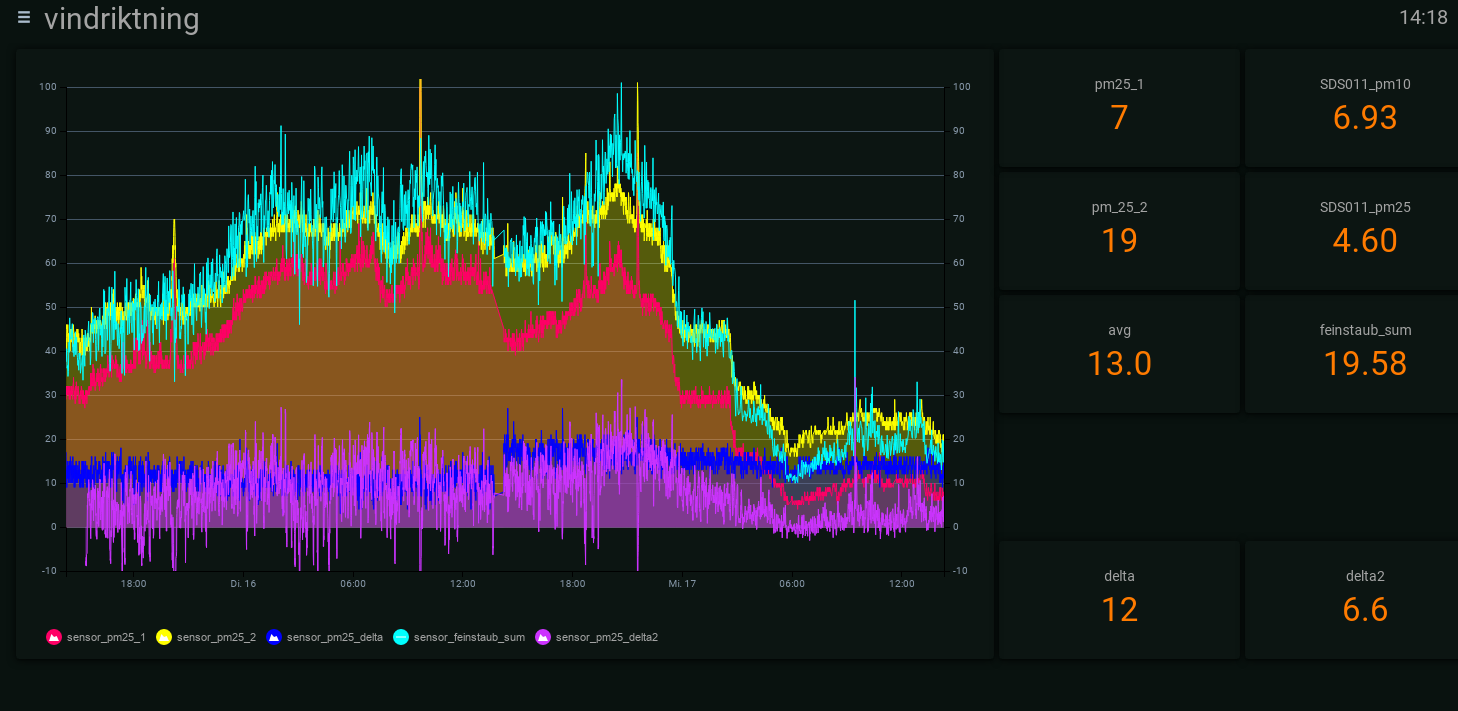
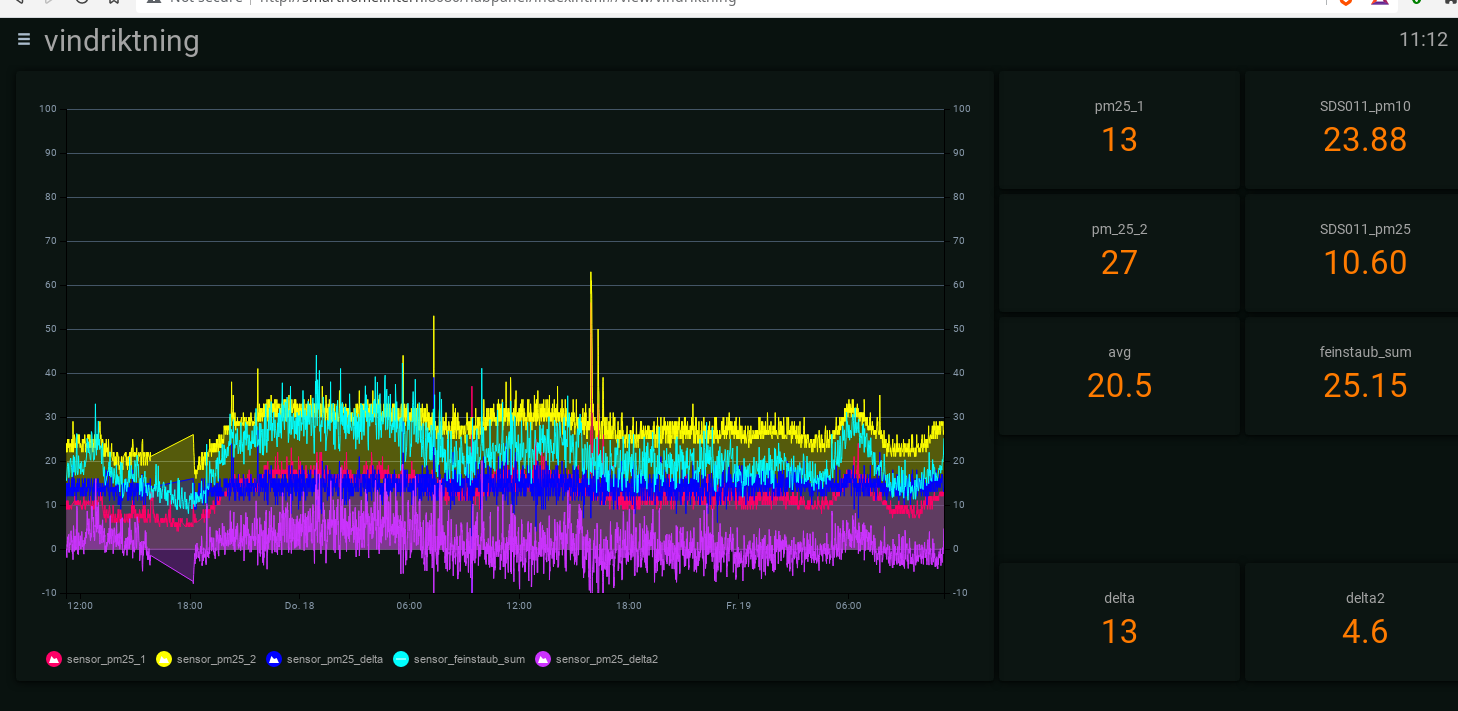
As a first impression SDS011 gives much lower readings for pm25 than those of the vindriktning sensors, currently half or even a third. As I set up this experiment the weather is foggy/grey with temperatures around 6°C and rHumidity around 90%. SDS011 gives pm25 at ~15 and pm10 around 30 which is rather high. I assume part of the measured particles are water droplets. Vindriktning gives 37 or 48, avg at 43 The values are undulating with every measurement so it is more about the relation than the precise value. It appears that the avg of the 2 vindriktning sensors is in a very similar range with the sum of the pm10 and pm25 readings of the SDS011 sensor.
I will let the setup run for a while, hopefully catching different weather conditions over time.
The first hypothesis is that the vindriktning sensors do not limit their measurement to just pm25 but actually measure larger particle sizes as well.