With endless streaming sources, how do we generate analytics? Windowing is a meaningful way of aggregating data into useful chunks. A consumer operation, not a producer operation.
Think of it as a group_by operation for streaming data.
Note the two attached python scripts that use the NYC Taxi Data and group results by either day or hour (of a single day). This is a way of getting simple aggregate counts, but can also serve as the basic "chunk" for deeper analytics within each chunk of time.
The GROUP BY SQL operation can aggregate data along any metric of the data, provided the data is already at rest in a table.
So the question becomes: How do you aggregate/count/analyze data as it continues to stream in?
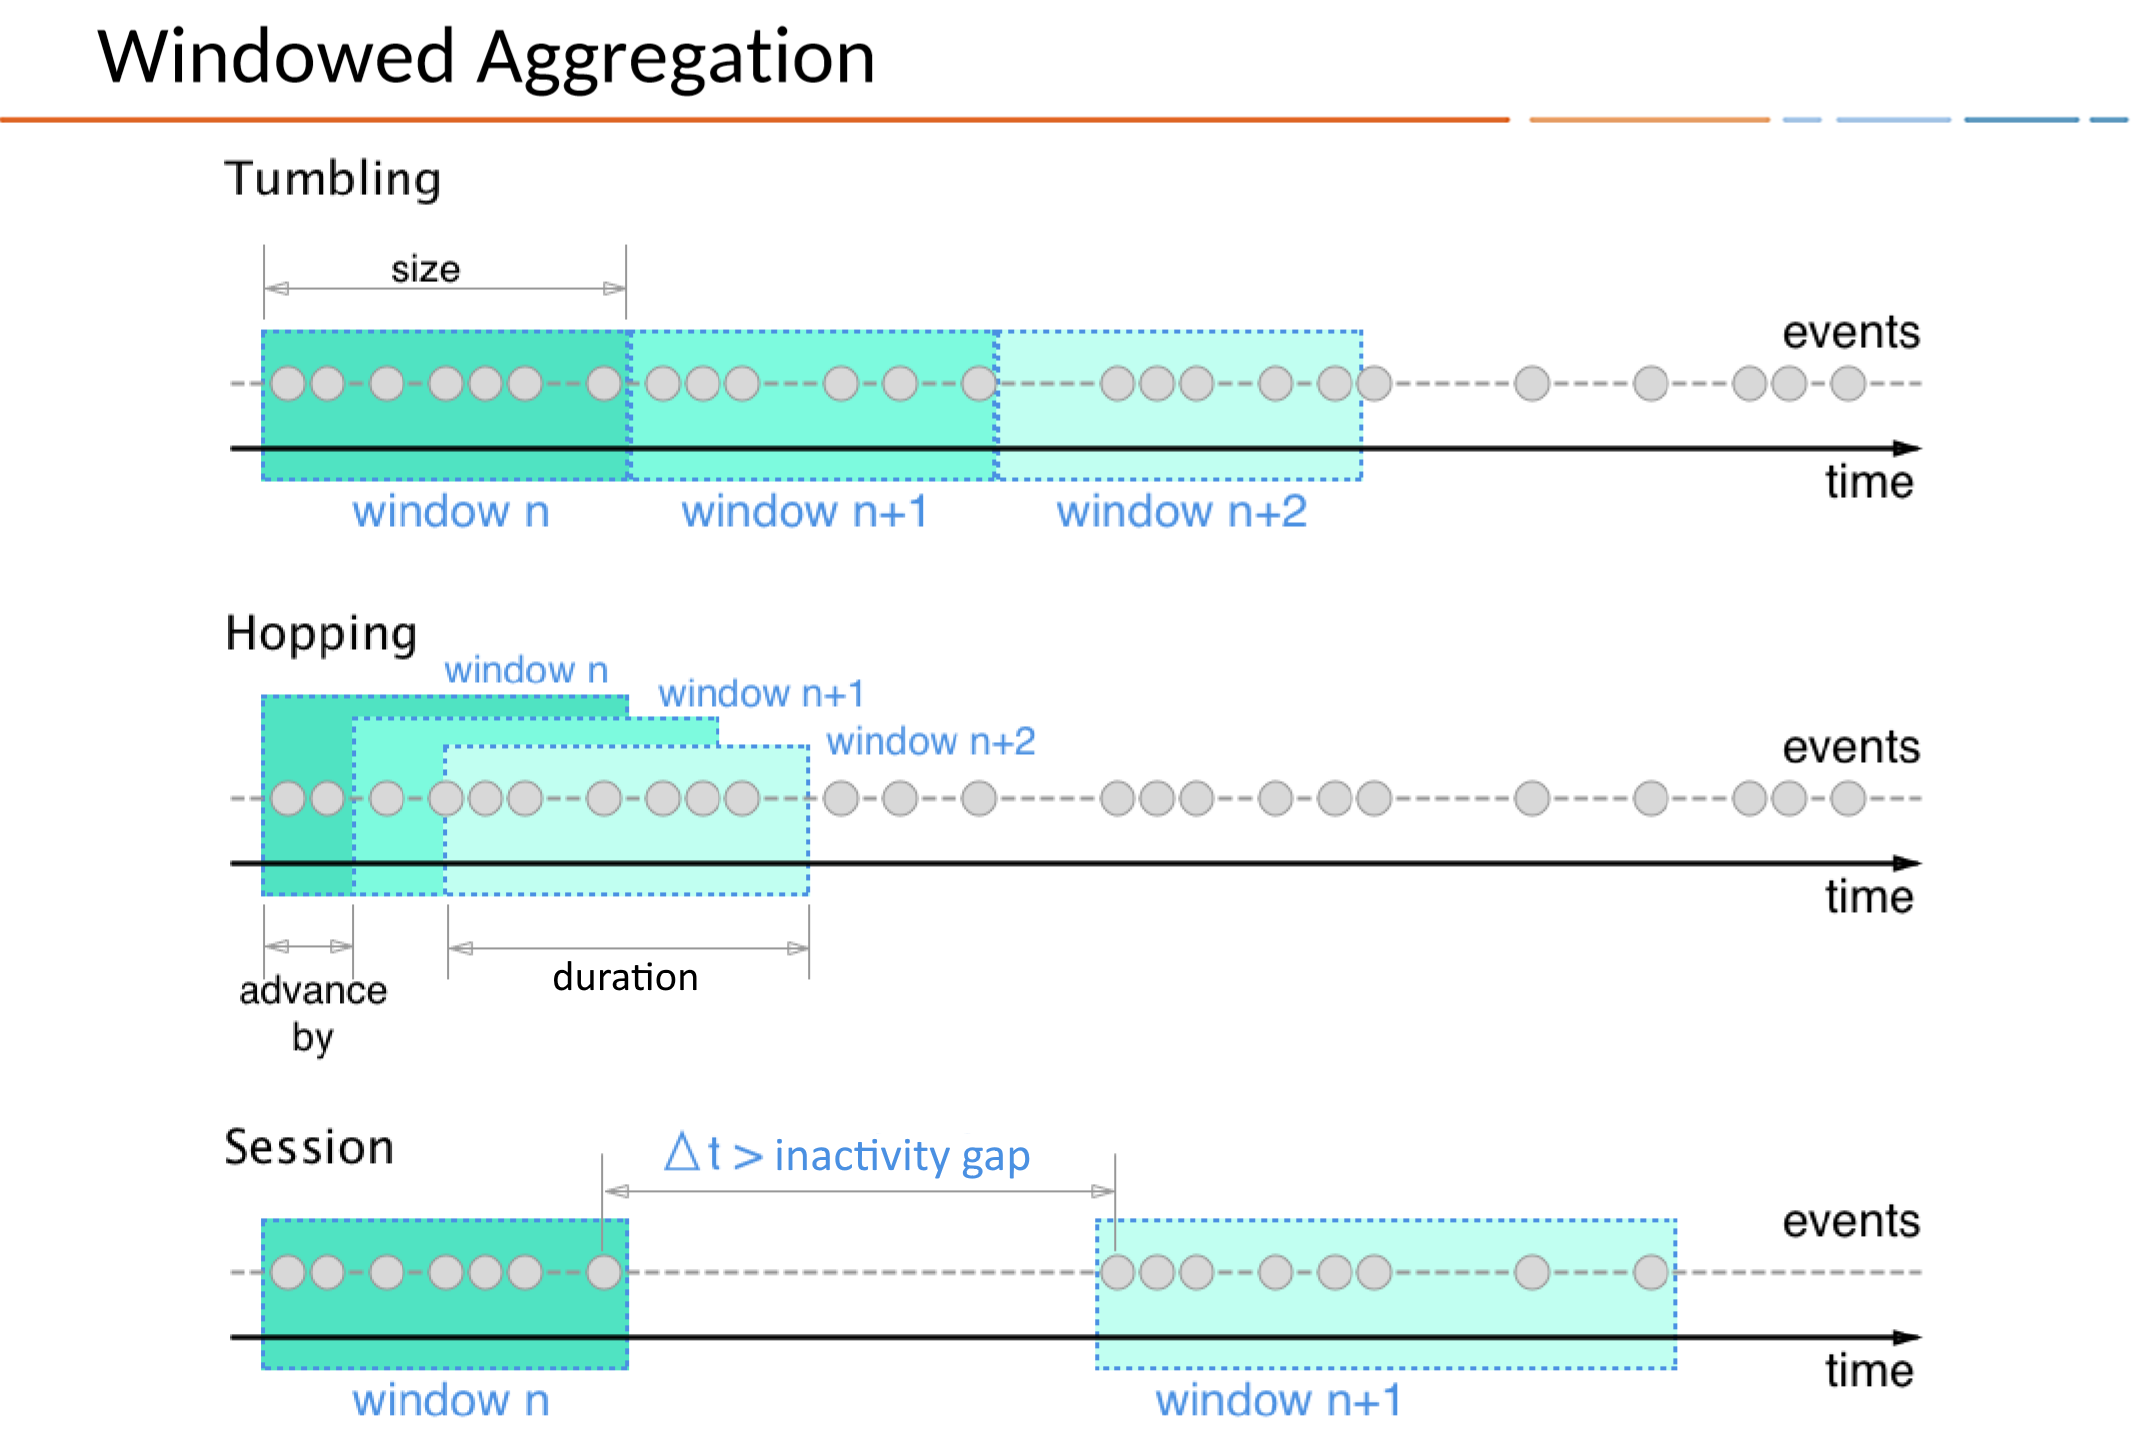
There are a few common windowing types:
- Tumbling – fixed, non-overlapping chunks (every N minutes, etc.)
- Sliding / Hopping – overlapping chunks (rolling 1-hr window updating every 5 mins)
- Session – dynamic window based on activity gaps
When consuming from Kafka we can do this in a few ways:
- Kafka Streams
- Apache Flink
- Spark Structured Streaming
Windows are computed at the end of each iteration of a defined window.
See this page for an example. This script consumes Wikipedia edit events from a Kafka topic and counts how many events of each type (edit, new, log, etc.) occur within consecutive 3-minute tumbling windows. When each window completes, it prints the event type, the count of events, and the window's time range.