You signed in with another tab or window. Reload to refresh your session.You signed out in another tab or window. Reload to refresh your session.You switched accounts on another tab or window. Reload to refresh your session.Dismiss alert
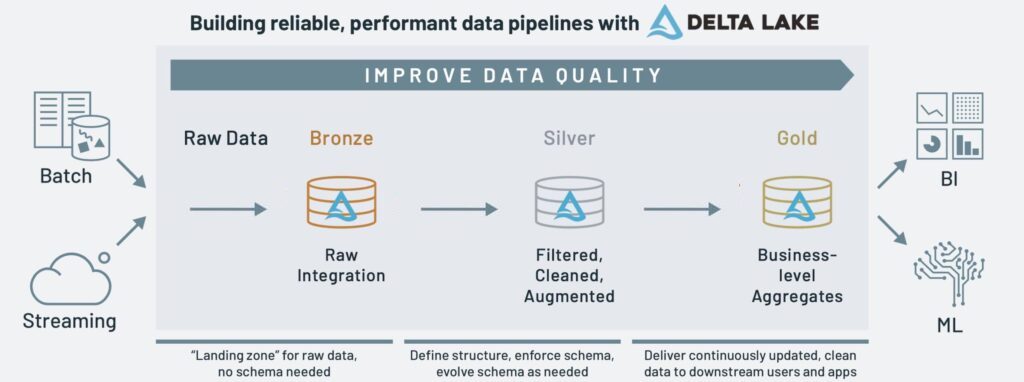
Medallion Architecture’s Compatibility with Data Mesh
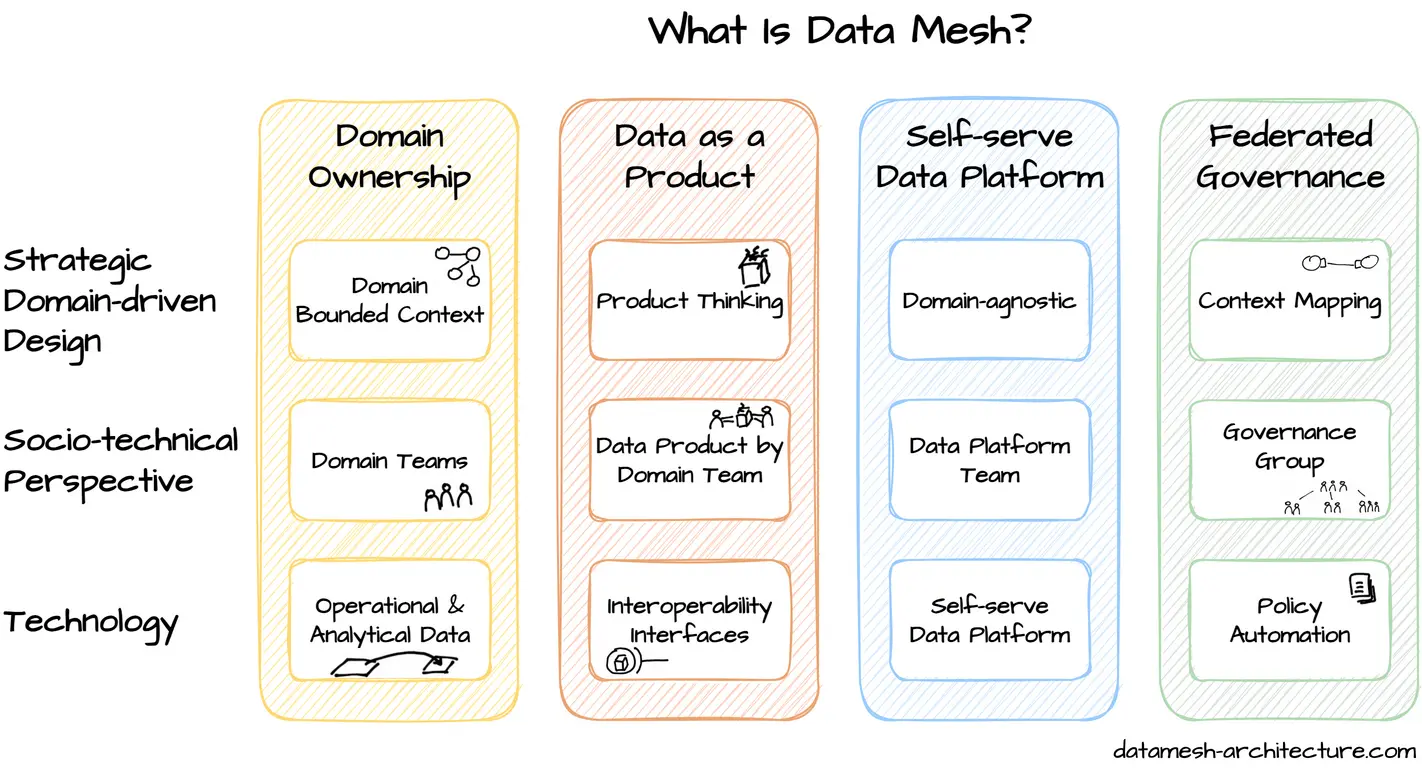
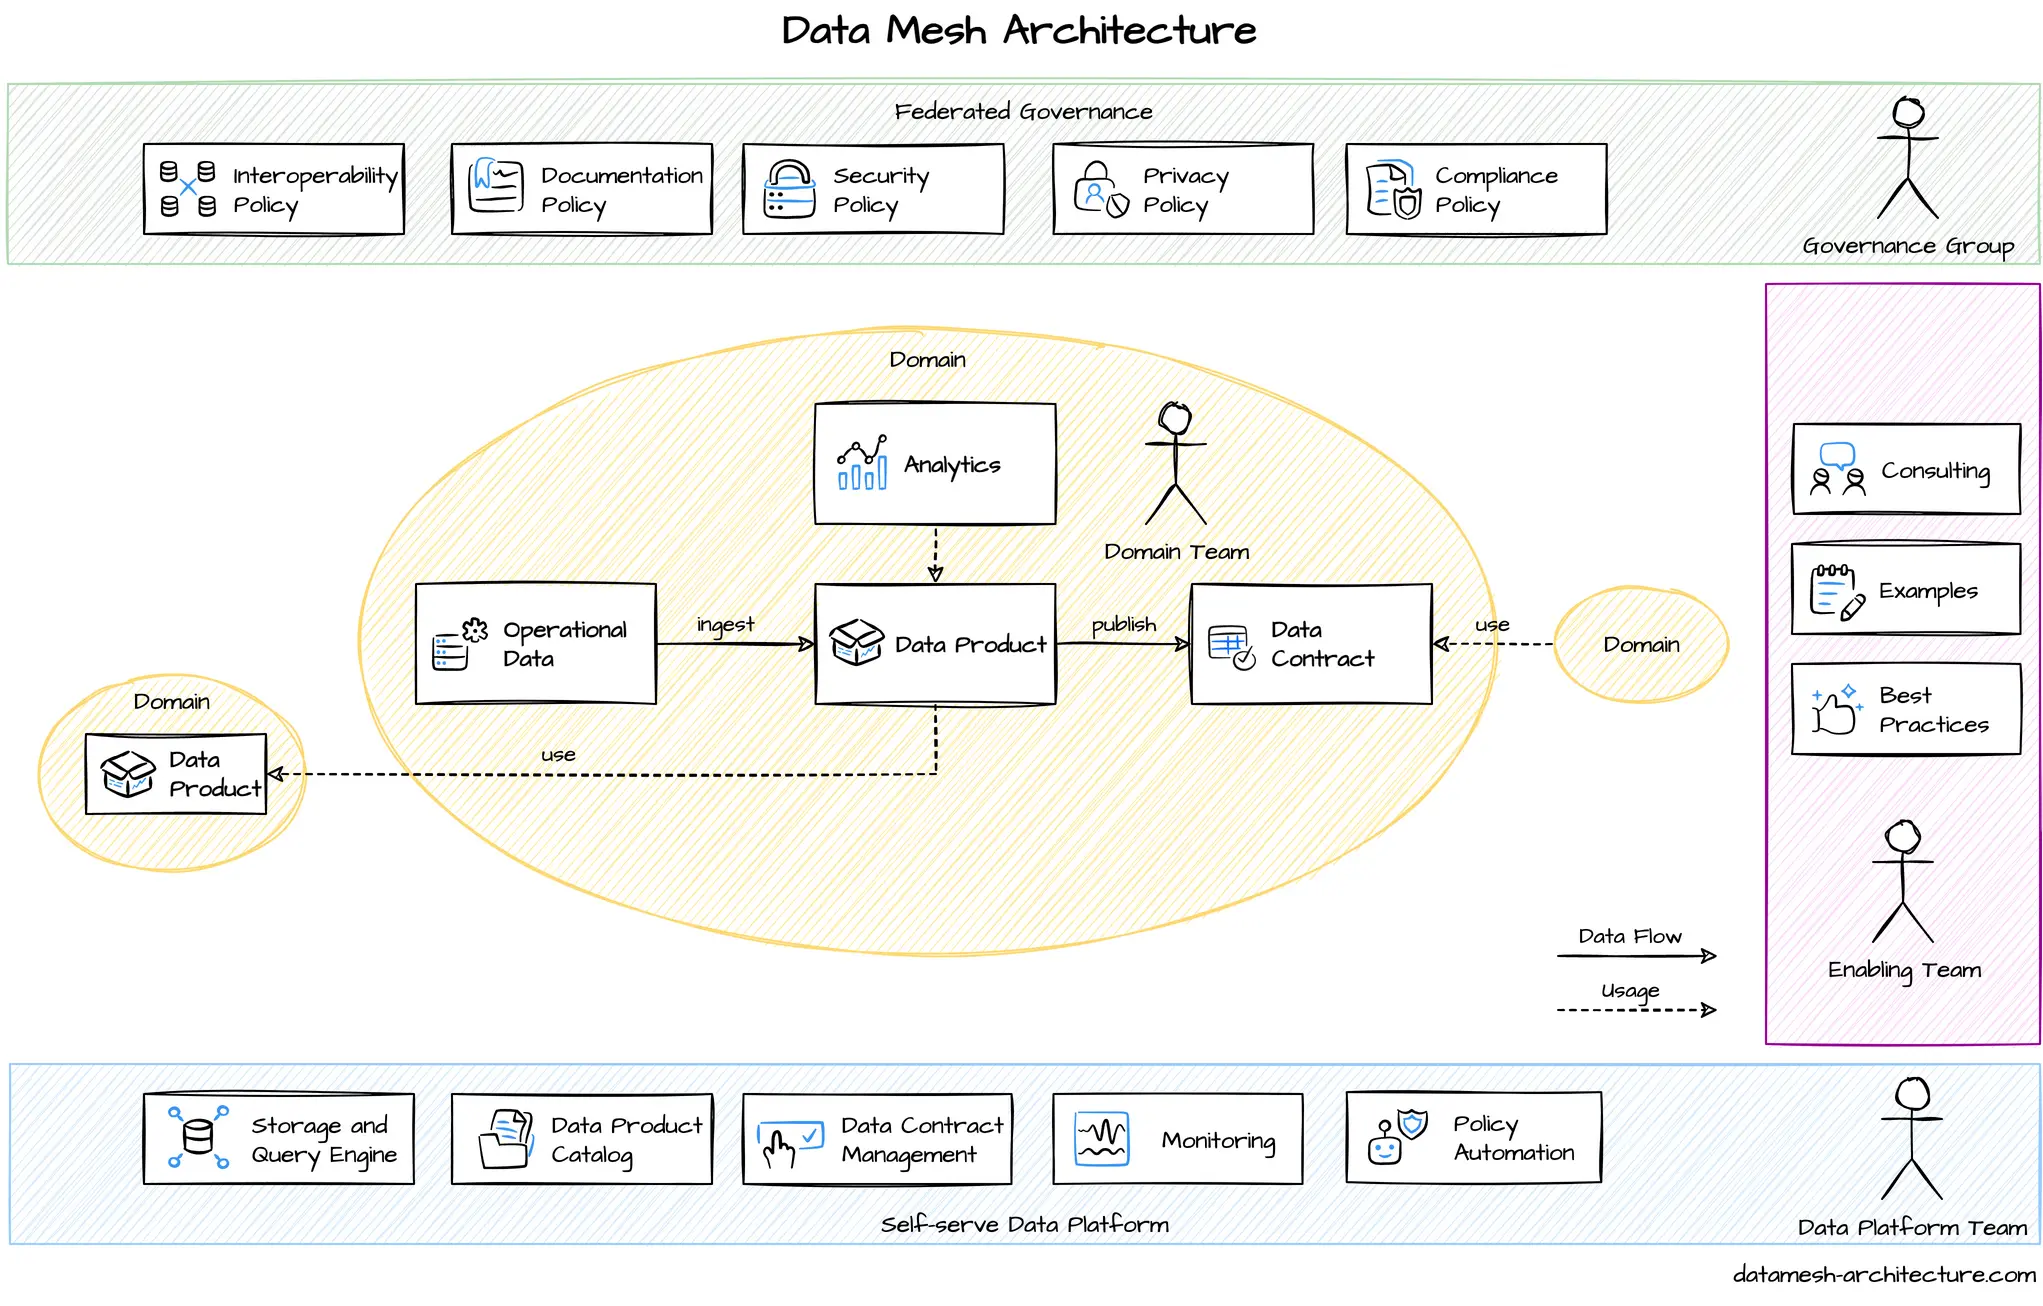
The Medallion Architecture and Data Mesh are two modern data paradigms that aim to improve data scalability, quality, and accessibility within an organization. Though they are distinct concepts, they can complement them when applied together. Let’s break down both in detail and explore how they can interoperate, especially with ideas like the “one-to-many” table relationships in the Medallion Architecture.
How the “One-to-Many” Relationship Enhances a Data Mesh
In a Medallion Architecture with a Data Mesh implementation, the “one-to-many” relationship can play a pivotal role in fostering data reuse and interoperability across domains:
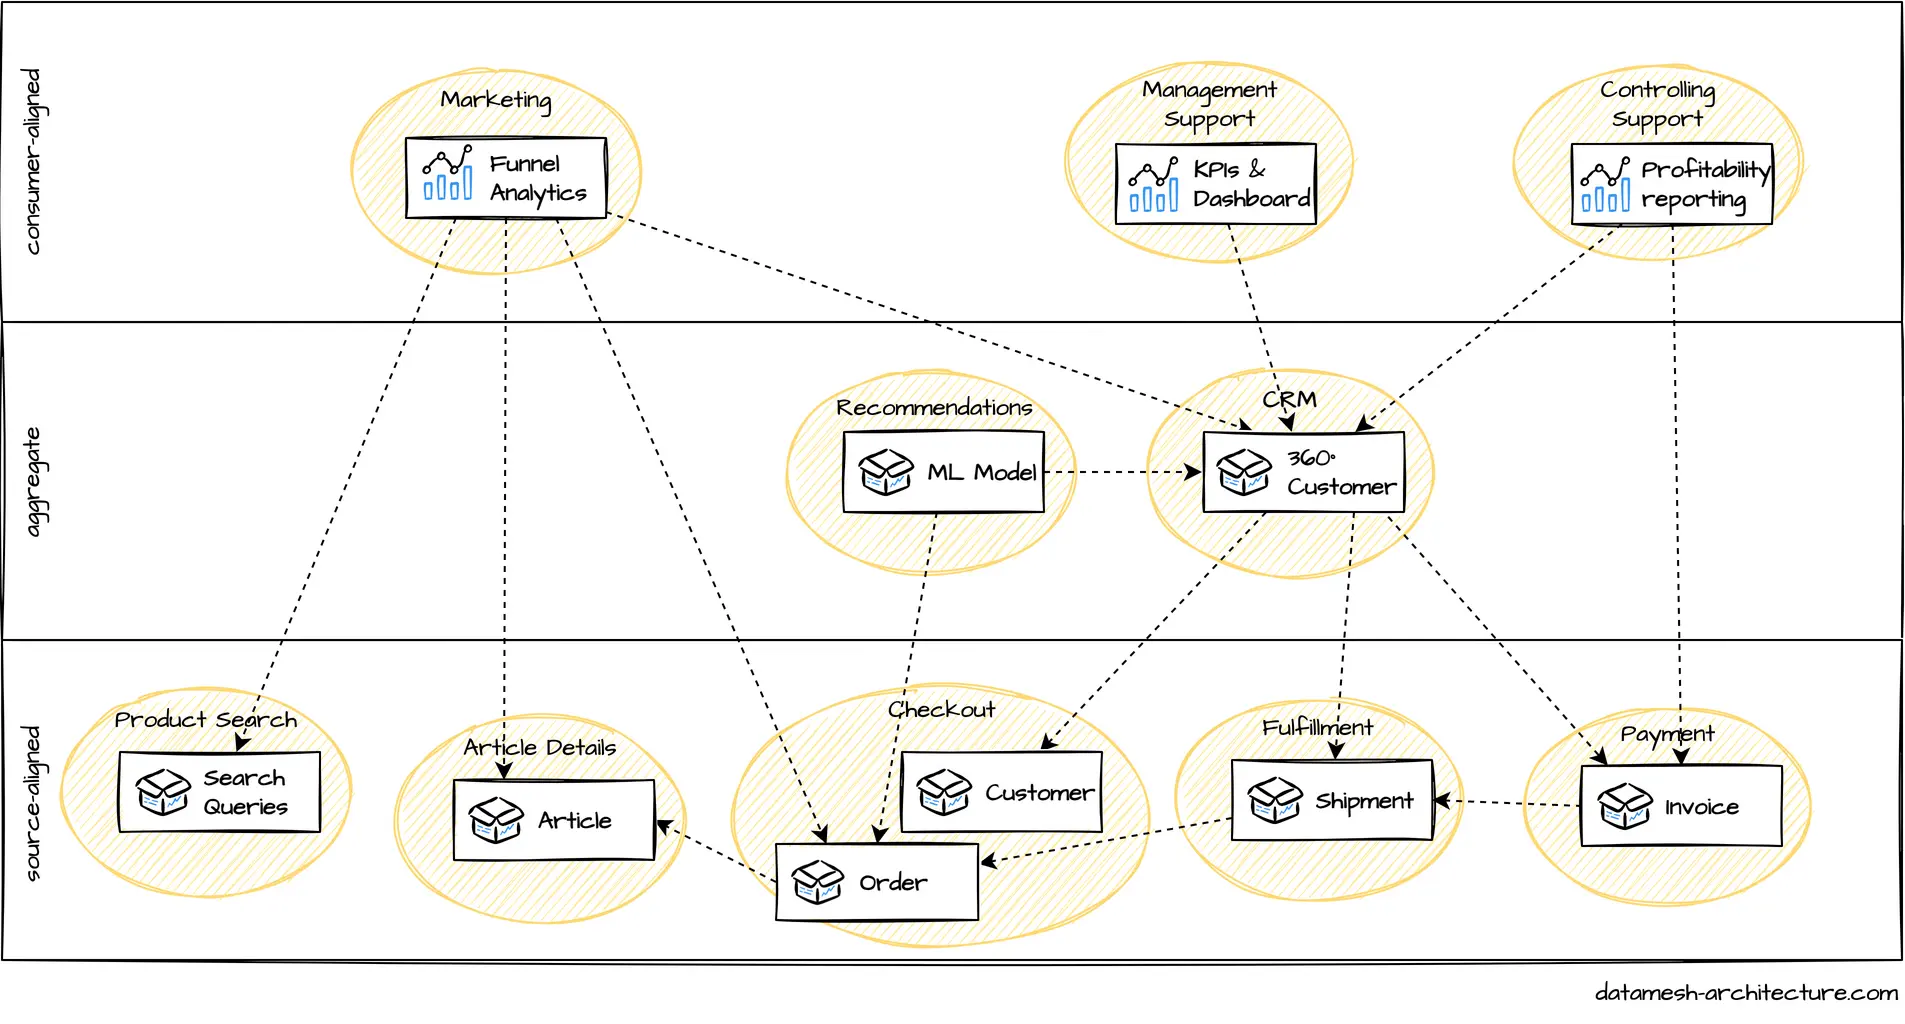
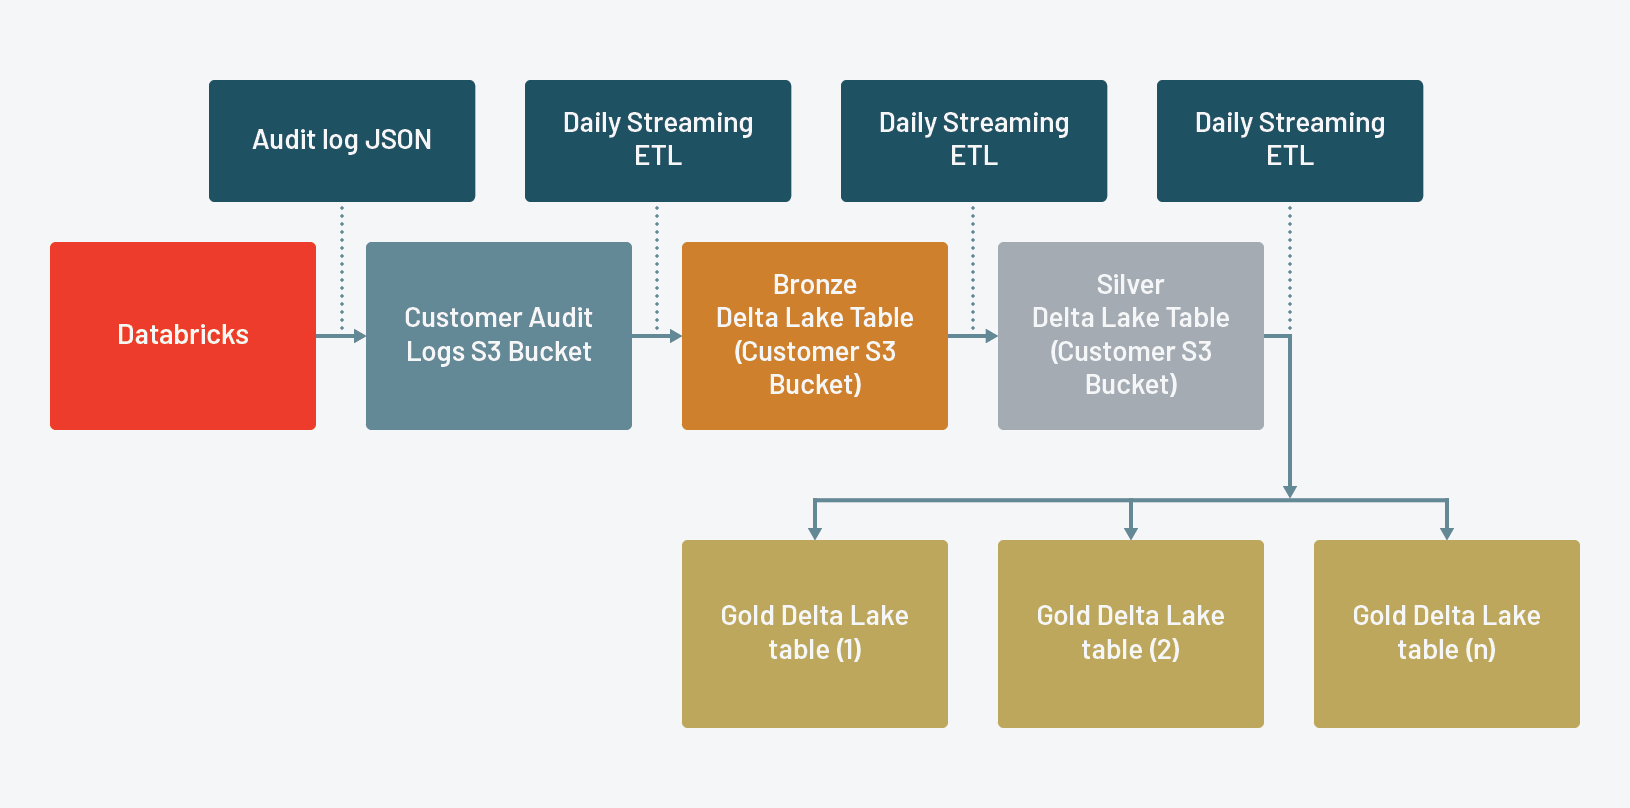
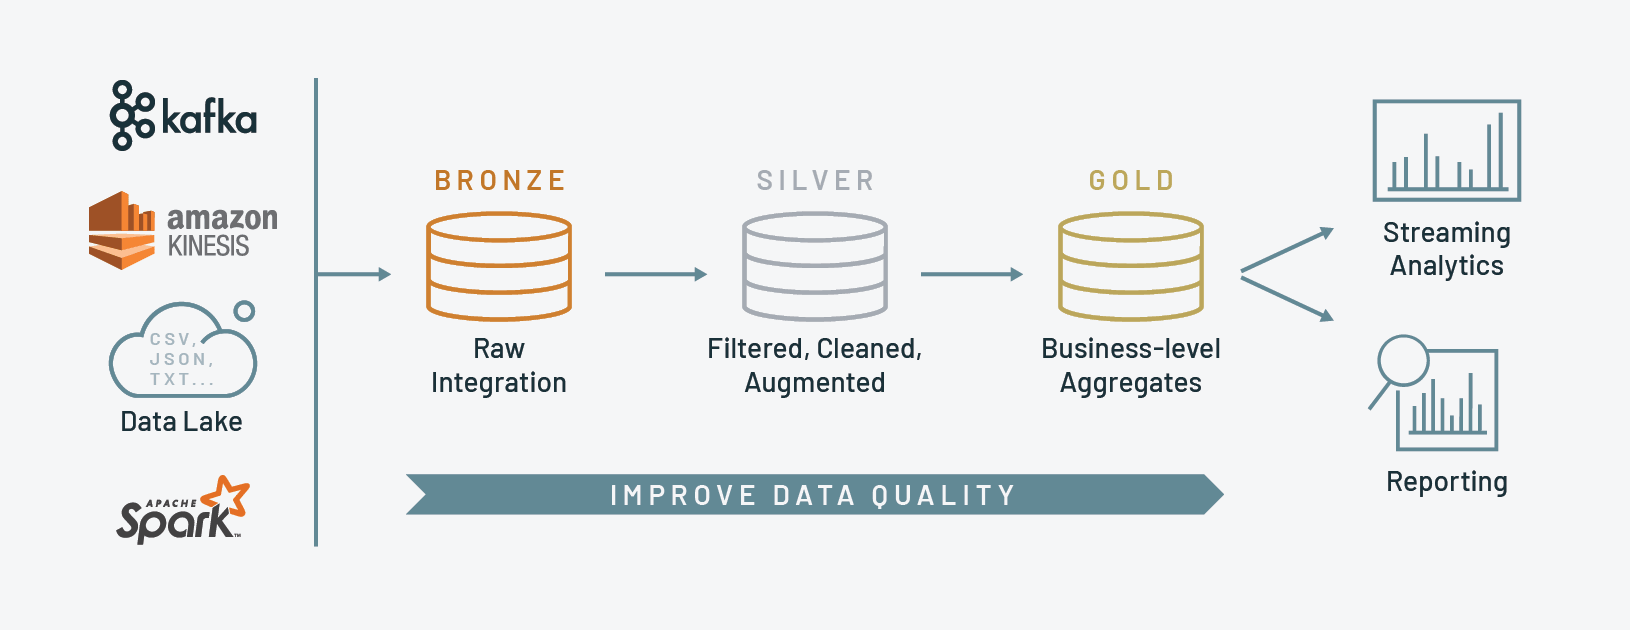
Bronze-to-Silver: A single bronze table can feed multiple silver tables. For instance, if a central logging system produces raw logs in the bronze layer, different domains can access this raw data, transform it, and create their own domain-specific Silver tables from it.
Silver-to-Gold: A single Silver table (cleaned and transformed data) can be used by multiple domains to create different Gold tables (aggregated and refined data products). For example, cleaned customer data in the Silver layer could be used by marketing to build engagement reports and by finance to analyze customer lifetime value (CLV).
This makes the architecture flexible and scalable, allowing for various business use cases and insights to be generated from the same upstream data.
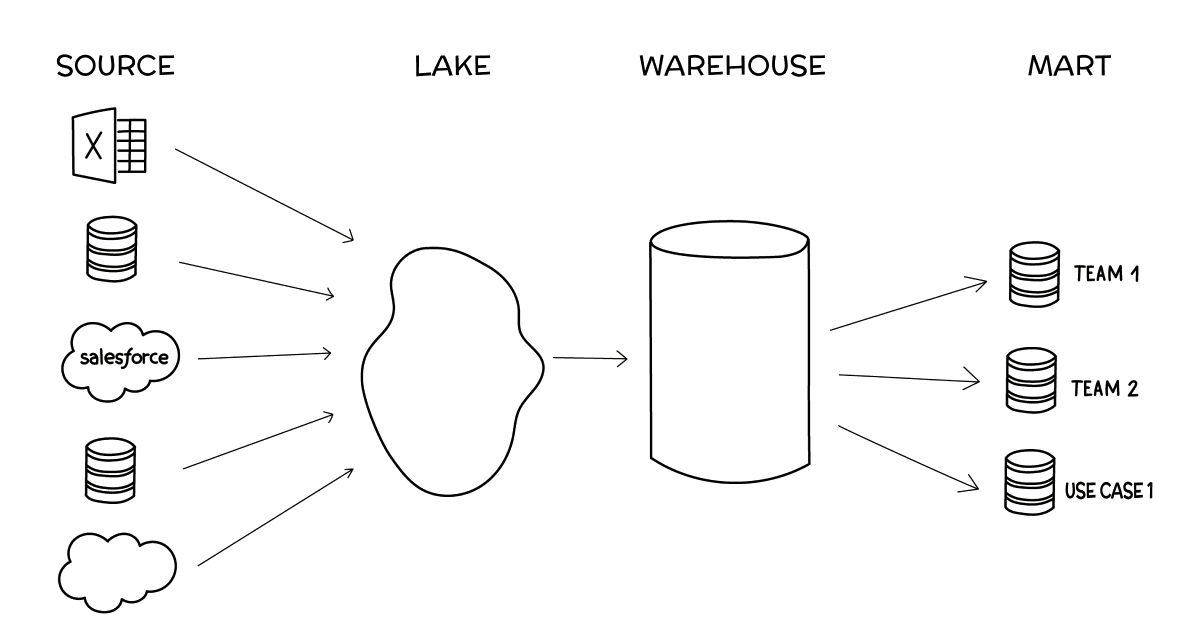
Data Lakes and Houses will contain Accumulators and Descriptors, not nessesiarly Facts and Dimensions.
The only reason I don’t like to call Fact tables Fact tables in Data Lakes, and Dimensions as Dimensions, is because of the historical context around Fact and Dimensions and all that entails. It gives a certain impression about the Data Model under discussion, and I like to make distinctions.
Accumulators
Accumulators in a Data Lake aggregate or accumulate the transactional records, pretty much like a Fact table would have in the past. The main difference will be that the Accumulator table will probably contain fewer “keys” that point to other tables, that would most likely have been stripped out and put into a Dimension table in the classic SQL Kimball model.
Descriptors
The Descriptors in the new Data Lake or Lake House are exactly like Dimensions, again they are just less broken up and normalized, there are just fewer of them. If the business requires say some distinct list of addresses, that would just be done an additional sub table probably run and filled much like a Data Mart or analytic further downstream. It wouldn’t be built into the Descriptor Tables and given keys that are referen ced in an Accumulator table.
At the heart of Minerva’s configuration system are event sources and dimension sources, which correspond to fact tables and dimension tables in a Star Schema design, respectively.
Figure 1: Event sources and dimension sources are the fundamental building blocks of Minerva.
Figure 3: Programmatic denormalization generates dimension sets which users can easily configure.
20201222 7 most common data preparation transformations in AWS Glue DataBrew | AWS Big Data Blog, EN, ★★★
Cube is the headless business intelligence platform. It helps data engineers and application developers access data from modern data stores, organize it into consistent definitions, and deliver it to every application.
When presented with a new dataset, human data scientists explore it in order to identify salient properties of the data elements, identify relationships between entities, and write processing software that makes use of those relationships accordingly. While there has been progress made on automatically processing the data to generate features or models, most automation systems rely on receiving a data model that has all the meta information about the data, including salient properties and relationships. In this thesis, we present a first version of our system, called ADELAutomatic Data Elements Linking. Given a collection of files, this system generates a relational data schema and identifies other salient properties. It detects the type of each data field, which describes not only the programmatic data type but also the context in which the data originated, through a method called Type Detection. For each file, it identifies the field that uniquely describes each row in it, also known as a Primary Key. Then, it discovers relationships between different data entities with Relationship Discovery, and discovers any implicit constraints in the data through Hard Constraint Discovery. We posit two out of these four problems as learning problems.
To evaluate our algorithms, we compare the results of each to a set of manual annotations. For Type Detection, we saw a max error of 7%, with an average error of 2.2% across all datasets. For Primary Key Detection, we classified all existing primary keys correctly, and had one false positive across five datasets. For Relationship Discovery, we saw an average error of 5.6%. (Our results are limited by the small number of manual annotations we currently possess.)
We then feed the output of our system into existing semi-automated data science software systems – the Deep Feature Synthesis (DFS) algorithm, which generates features for predictive models, and the Synthetic Data Vault (SDV), which generates a hierarchical graphical model. When ADEL’s data annotations are fed into DFS, it produces similar or higher predictive accuracy in 3/4 problems, and when they are provided to SDV, it is able to generate synthetic data with no constraint violations.
Automatic detection and inference of relationships in Power Pivot
One of the advantages to importing data using the Power Pivot add-in is that Power Pivot can sometimes detect relationships and create new relationships in the Data Model it creates in Excel.
When you import multiple tables, Power Pivot automatically detects any existing relationships among the tables. Also, when you create a PivotTable, Power Pivot analyzes the data in the tables. It detects possible relationships that have not been defined, and suggests appropriate columns to include in those relationships.
The detection algorithm uses statistical data about the values and metadata of columns to make inferences about the probability of relationships.
DataCleaner: DataCleaner is a Data Quality toolkit that allows you to profile, correct and enrich your data. People use it for ad-hoc analysis, recurring cleansing as well as a swiss-army knife in matching and Master Data Management solutions.
Singer describes how data extraction scripts—called “taps” —and data loading scripts—called “targets”— should communicate, allowing them to be used in any combination to move data from any source to any destination. Send data between databases, web APIs, files, queues, and just about anything else you can think of.
Features
Unix-inspired: Singer taps and targets are simple applications composed with pipes—no daemons or complicated plugins needed.
JSON-based: Singer applications communicate with JSON, making them easy to work with and implement in any programming language. Singer also supports JSON Schema to provide rich data types and rigid structure when needed.
Efficient: Singer makes it easy to maintain state between invocations to support incremental extraction.
[1.7.Fivetran]
Fivetran is the automated data movement platform moving data out of, into and across your cloud data platforms.
How long does the access last? This comes with lifetime access to the content. Lifetime access is the lifetime of our company and our ability to support this.
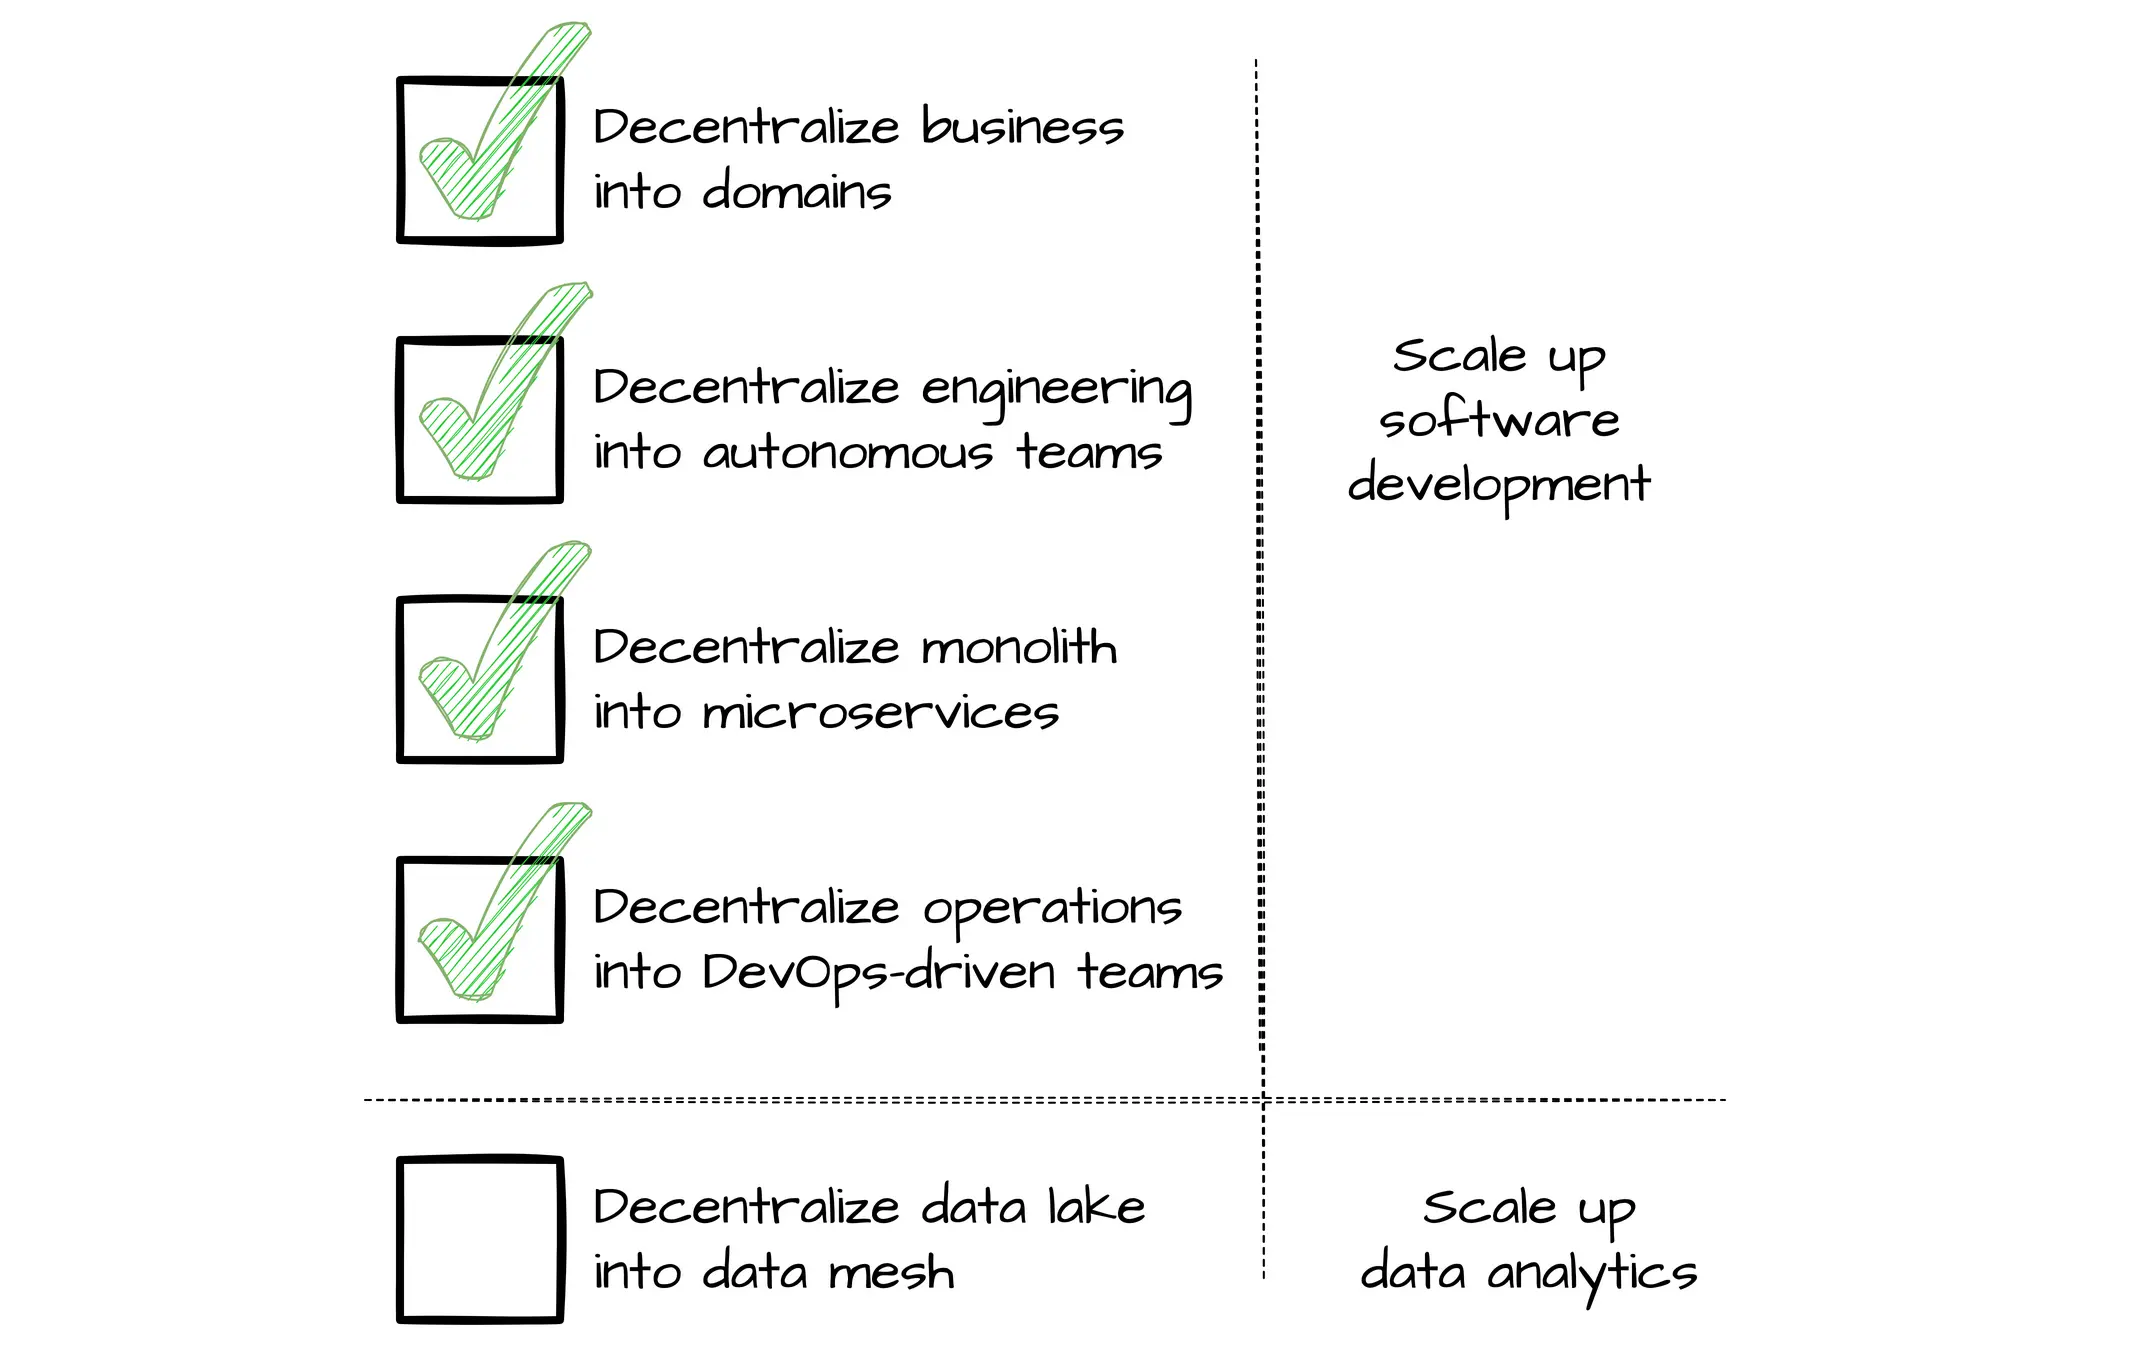
Understand DataOps in the context of a century-long evolution of ideas that improve how people manage complex systems. It started with pioneers like W. Edwards Deming and statistical process control - gradually these ideas crossed into the technology space in the form of Agile, DevOps and now, DataOps.
This project describes the data contract being used in the implementation of Data Mesh at PayPal. It is available for you as an Apache 2.0 license. Contributions are welcome!
What is a Data Contract?
The basics of a data contract
A data contract defines the agreement between a data producer and consumer. A data contract contains several sections:
Our highest priority is to satisfy the customer through the early and continuous delivery of valuable analytic insights from a couple of minutes to weeks.
(2) Value working analytics:
We believe the primary measure of data analytics performance is the degree to which insightful analytics are delivered, incorporating accurate data, atop robust frameworks and systems.
(3) Embrace change:
We welcome evolving customer needs, and in fact, we embrace them to generate competitive advantage. We believe that the most efficient, effective, and agile method of communication with customers is face-to-face conversation.
(4) It’s a team sport:
Analytic teams will always have a variety of roles, skills, favorite tools, and titles. A diversity of backgrounds and opinions increases innovation and productivity.
(5) Daily interactions:
Customers, analytic teams, and operations must work together daily throughout the project.
(6) Self-organize:
We believe that the best analytic insight, algorithms, architectures, requirements, and designs emerge from self-organizing teams.
(7) Reduce heroism:
As the pace and breadth of need for analytic insights ever increases, we believe analytic teams should strive to reduce heroism and create sustainable and scalable data analytic teams and processes.
(8) Reflect:
Analytic teams should fine-tune their operational performance by self-reflecting, at regular intervals, on feedback provided by their customers, themselves, and operational statistics.
(9) Analytics is code:
Analytic teams use a variety of individual tools to access, integrate, model, and visualize data. Fundamentally, each of these tools generates code and configuration which describes the actions taken upon data to deliver insight.
(10) Orchestrate:
The beginning-to-end orchestration of data, tools, code, environments, and the analytic teams work is a key driver of analytic success.
(11) Make it reproducible:
Reproducible results are required and therefore we version everything: data, low-level hardware and software configurations, and the code and configuration specific to each tool in the toolchain.
(12) Disposable environments:
We believe it is important to minimize the cost for analytic team members to experiment by giving them easy to create, isolated, safe, and disposable technical environments that reflect their production environment.
(13) Simplicity:
We believe that continuous attention to technical excellence and good design enhances agility; likewise simplicity–the art of maximizing the amount of work not done–is essential.
(14) Analytics is manufacturing:
Analytic pipelines are analogous to lean manufacturing lines. We believe a fundamental concept of DataOps is a focus on process-thinking aimed at achieving continuous efficiencies in the manufacture of analytic insight.
(15) Quality is paramount:
Analytic pipelines should be built with a foundation capable of automated detection of abnormalities (jidoka) and security issues in code, configuration, and data, and should provide continuous feedback to operators for error avoidance (poka yoke).
(16) Monitor quality and performance:
Our goal is to have performance, security and quality measures that are monitored continuously to detect unexpected variation and generate operational statistics.
(17) Reuse:
We believe a foundational aspect of analytic insight manufacturing efficiency is to avoid the repetition of previous work by the individual or team.
(18) Improve cycle times:
We should strive to minimize the time and effort to turn a customer need into an analytic idea, create it in development, release it as a repeatable production process, and finally refactor and reuse that product.
A DataOps cycle has eight stages: planning, development, integration, testing, release, deployment, operation, and monitoring. A DataOps engineer must be well versed in all of these stages in order to have a seamless DataOps infrastructure.
Planning
Partnering with product, engineering, and business teams to set KPIs, SLAs, and SLIs for the quality and availability of data.
Development
Building the data products and machine learning models that will power your data application.
Integration
Integrating the code and/or data product within your existing tech and or data stack. For example, you might integrate a dbt model with Airflow so the dbt module can automatically run.
Testing
Testing your data to make sure it matches business logic and meets basic operational thresholds (such as uniqueness of your data or no null values).
Release
Releasing your data into a test environment.
Deployment
Merging your data into production.
Operate
Running your data into applications such as Looker or Tableau dashboards and data loaders that feed machine learning models.
Monitor
Continuously monitoring and alerting for any anomalies in the data
You can use the .submit() method on a task function to submit the task to a task runner. Using a task runner enables you to control whether tasks run sequentially, concurrently, or if you want to take advantage of a parallel or distributed execution library such as Dask or Ray.
Using the .submit() method to submit a task also causes the task run to return a PrefectFuture, a Prefect object that contains both any data returned by the task function and a State, a Prefect object indicating the state of the task run.
Prefect currently provides the following built-in task runners:
SequentialTaskRunner can run tasks sequentially.
ConcurrentTaskRunner can run tasks concurrently, allowing tasks to switch when blocking on IO. Tasks will be submitted to a thread pool maintained by anyio.
Using results from submitted tasks
from prefect import flow, task

@task
def my_task():
    return 42

@flow
def my_flow():
    future = my_task.submit()

    result = future.result(raise_on_failure=False)
    if future.get_state().is_failed():
        # `result` is an exception! handle accordingly
        ...
    else:
        # `result` is the expected return value of our task
        print(result)
        ...
#
my_flow()
You may also use the wait_for=[] parameter when calling a task, specifying upstream task dependencies. This enables you to control task execution order for tasks that do not share data dependencies.
@task
def task_a():
    pass

@task
def task_b():
    pass

@task
def task_c():
    pass

@task
def task_d():
    pass

@flow
def my_flow():
    a = task_a.submit()
    b = task_b.submit()
    # Wait for task_a and task_b to complete
    c = task_c.submit(wait_for=[a, b])
    # task_d will wait for task_c to complete
    # Note: If waiting for one task it must still be in a list.
    d = task_d(wait_for=[c])
Prefect refers to each step as a task. In a simple sense, a task is nothing more than a Python function. In fact, the easiest way to create a new task is just by decorating an existing function. Let's make a simple task that prints "Hello, world!":
Prefect has no restrictions on how much or how little each task can do. In general, we encourage "small tasks" over monolithic ones: each task should perform a discrete logical step of your workflow, but not more. This is because the Prefect engine does a lot of work to handle each task, including checkpointing the state after each task runs. Therefore, the more tasks you have, the more opportunities the engine has to be helpful.
Task inputs and outputs
Prefect tasks can optionally receive inputs and produce outputs. To take advantage of this feature, provide them in your task definition.
Flows
In Prefect, flows are used to describe the dependencies between tasks, such as their order or how they pass data around. If tasks are like functions, then you could think of a flow as a script that combines them in interesting ways.
Functional API
Here is a flow that uses the add task we wrote earlier to add a few numbers together. Notice how tasks can accept numbers or even other tasks as inputs; Prefect automatically creates the appropriate connections (or "edges") in the flow graph. In addition, notice that we call add twice, generating two distinct copies of our task in the flow:
Running the flow
Parameters
Sometimes, it's useful to provide information to a flow at runtime. Prefect provides a special task called a Parameter for this purpose.
Imperative API
The functional API makes it easy to define workflows in a script-like style. Sometimes, you may prefer to build flows in a more programmatic or explicit way. For this, we can use Prefect's imperative API.
Arc is an opinionated framework for defining predictable, repeatable and manageable data transformation pipelines;
predictable in that data is used to define transformations - not code.
repeatable in that if a job is executed multiple times it will produce the same result.
manageable in that execution considerations and logging have been baked in from the start
Currently it is tightly coupled to Apache Spark due to its fault-tolerance, performance and solid API for standard data engineering tasks but the definitions are human and machine readable HOCON (a JSON derivative) allowing the transformation definitions to be implemented against future execution engines.
Great Expectations is the leading tool for validating, documenting, and profiling your data to maintain quality and improve communication between teams. Head over to our getting started tutorial.
Reliable database capable of handling high read/write volumes
Able to support near-real-time data, as MySQL can be updated from streaming data sources
Cons
Complex aggregation queries of large datasets are not as performant as we would like and could bottleneck the MySQL instance as we continue to grow and the data size gets larger
We would need to upsert records in a batch to ensure historical data is up to date. Frequent and large batch inserts would reduce the performance of SELECT queries in flight
Pre-Aggregation of data with MySQL
Pros
Since data is pre-aggregated before loading into MySQL, queries are very efficient as they can completely leverage MySQL indexes to pull a single row of data
Cons
Unable to support near-real-time metrics, so pre-aggregations would need to be done in batches on a set cadence
Similar to the solution above, we would need to upsert records in batch to ensure historical data is up to date which could cause performance issues
We would need to pre-aggregate every necessary use case, potentially increasing the effort to maintain the service as new use cases with aggregation parameters arise down the line
Two OLTP Database Tables
One table stores raw events, and event updates trigger an asynchronous function to update all relevant metrics in the other, aggregated table.
Pros
Highly available, low query latency and eventually consistent
Cons
Hard to migrate event schema and redefine logic of metrics, because new metrics definition requires recalculation of all the pre-aggregated metrics
Not very scalable, especially while writing traffic is high
OLAP with Apache Pinotᵀᴹ
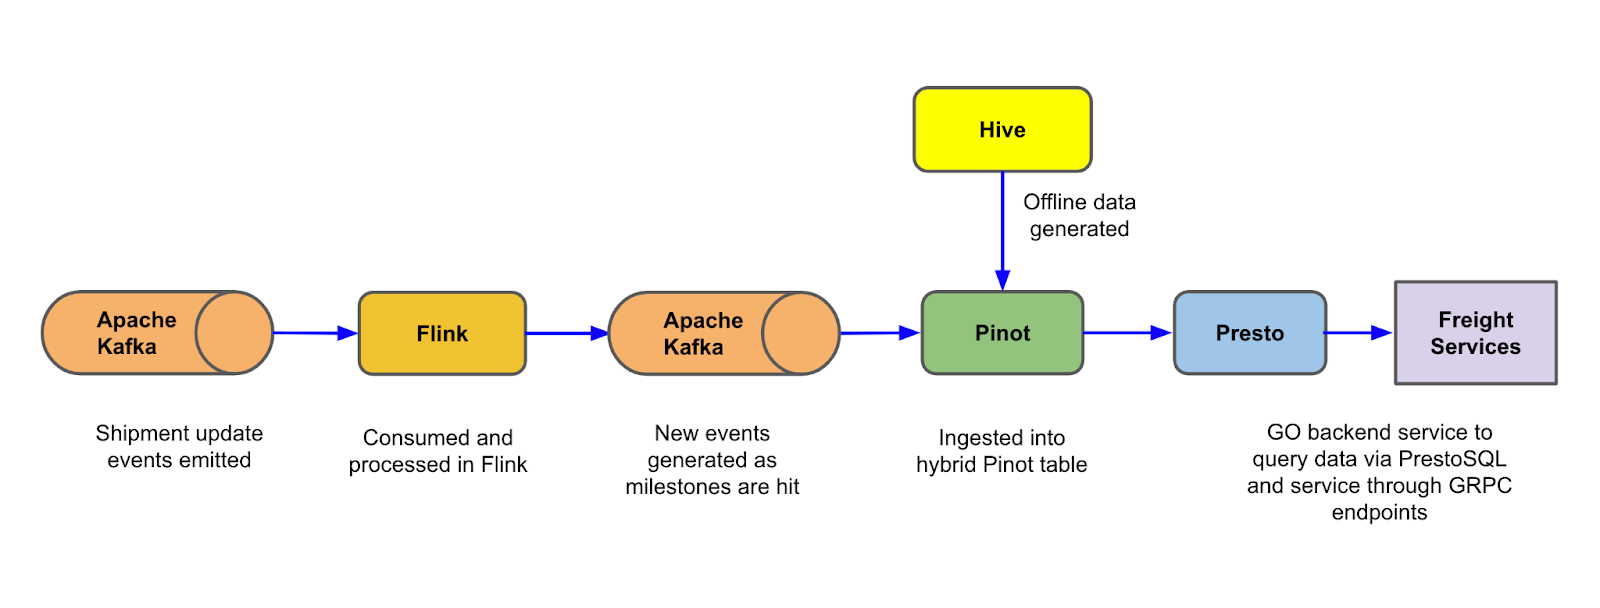
Apache Pinot is a realtime, distributed and scalable datastore designed to execute analytical queries at ultra-low latencies required for user-facing analytics. A single logical table (aka hybrid table) can be set up for both real-time and offline ingestion based on the lambda architecture.
Pros
Carrier performance data can be measured in real time by leveraging Apache Flink® and Kafka®, then these performance metrics events can be ingested into the real-time portion of the hybrid Pinot table.
Offline, cleaned data sources from HDFS can be used to fill the Offline portion of the hybrid Pinot table, ensuring any post-completion modifications to the shipment are accounted for.
Pinot provides many indexing options to enable low-latency aggregations and data selection queries
Cons
Business logic would need to be maintained in two separate places. While we already maintain logic to define these performance metrics in offline HDFS, we would also need to keep our real time Flink logic up to date to ensure they output consistent data.
Golang GRPC Service
Neutrino Presto
Neutrino is a primary query gateway to access the Pinot datasets at Uber. It is a slightly different deployment of Presto® where a coordinator and a worker runs on each host and is capable of running each query independently. Neutrino is a stateless and scalable regular Java microservice hosted on Mesos containers. It accepts PrestoSQL query, translates it into Pinot query language, and routes it to appropriate Pinot clusters.
Caching
When users open or refresh the Carrier Scorecard in the mobile app, 5 metrics will be fetched concurrently, which translates to 9 Neutrino queries, due to some metrics requiring more than one Neutrino query. P99 latency of our Neutrino queries is around 60ms, in order to reduce traffic to Neutrino and improve external latency, we added a Redis cache in front of Neutrino, which stores aggregated metrics. A TTL of 12 hours was set and we use the following strategies to ensure cache consistency as new events continue to flow in. On average, we were able to achieve >90% cache hit rate.
Cache Aside: When the request key is not yet cached during a read (cache miss), we query Neutrino and store the resulting metrics in Redis.
Event driven cache refreshing: When a raw milestone event occurs, we immediately invalidate all relevant keys in Redis. After a 2-minute wait period, we fetch the new results for all keys that were invalidated from Neutrino and update Redis. The 2-minute wait time is to ensure events were ingested into Pinot’s real-time table.
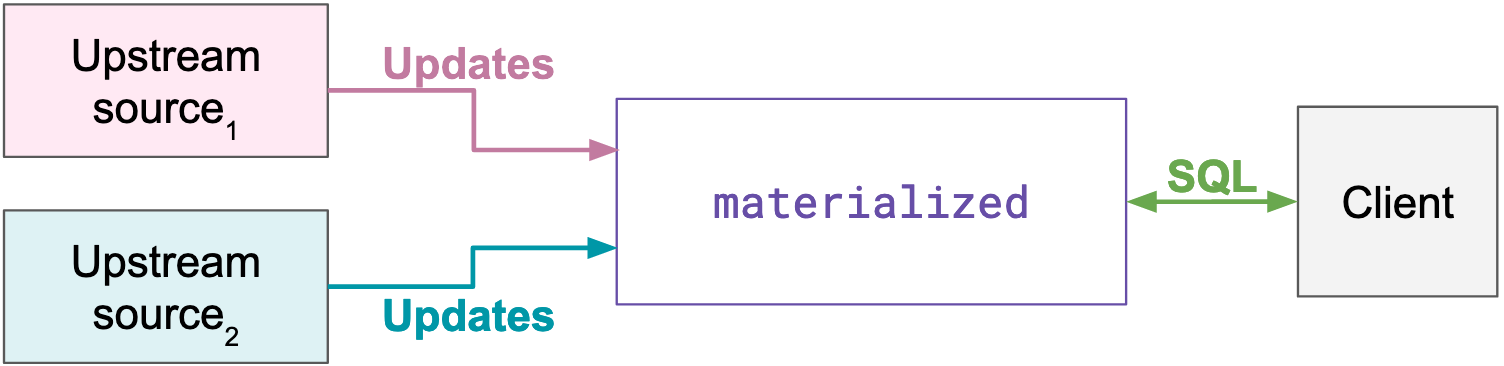
Materialize is a streaming database for real-time applications. It lets you ask complex questions about your data using SQL, and incrementally maintains the results of these SQL queries up-to-date as the underlying data changes.
Welcome to the first virtual Hack Day hosted by Materialize and our good friends at Redpanda and dbt Labs! The goal of this event is to encourage knowledge-sharing between our communities (we've already learned so much just putting it together!), and give you a taste of what building streaming analytics pipelines with this stack looks like.
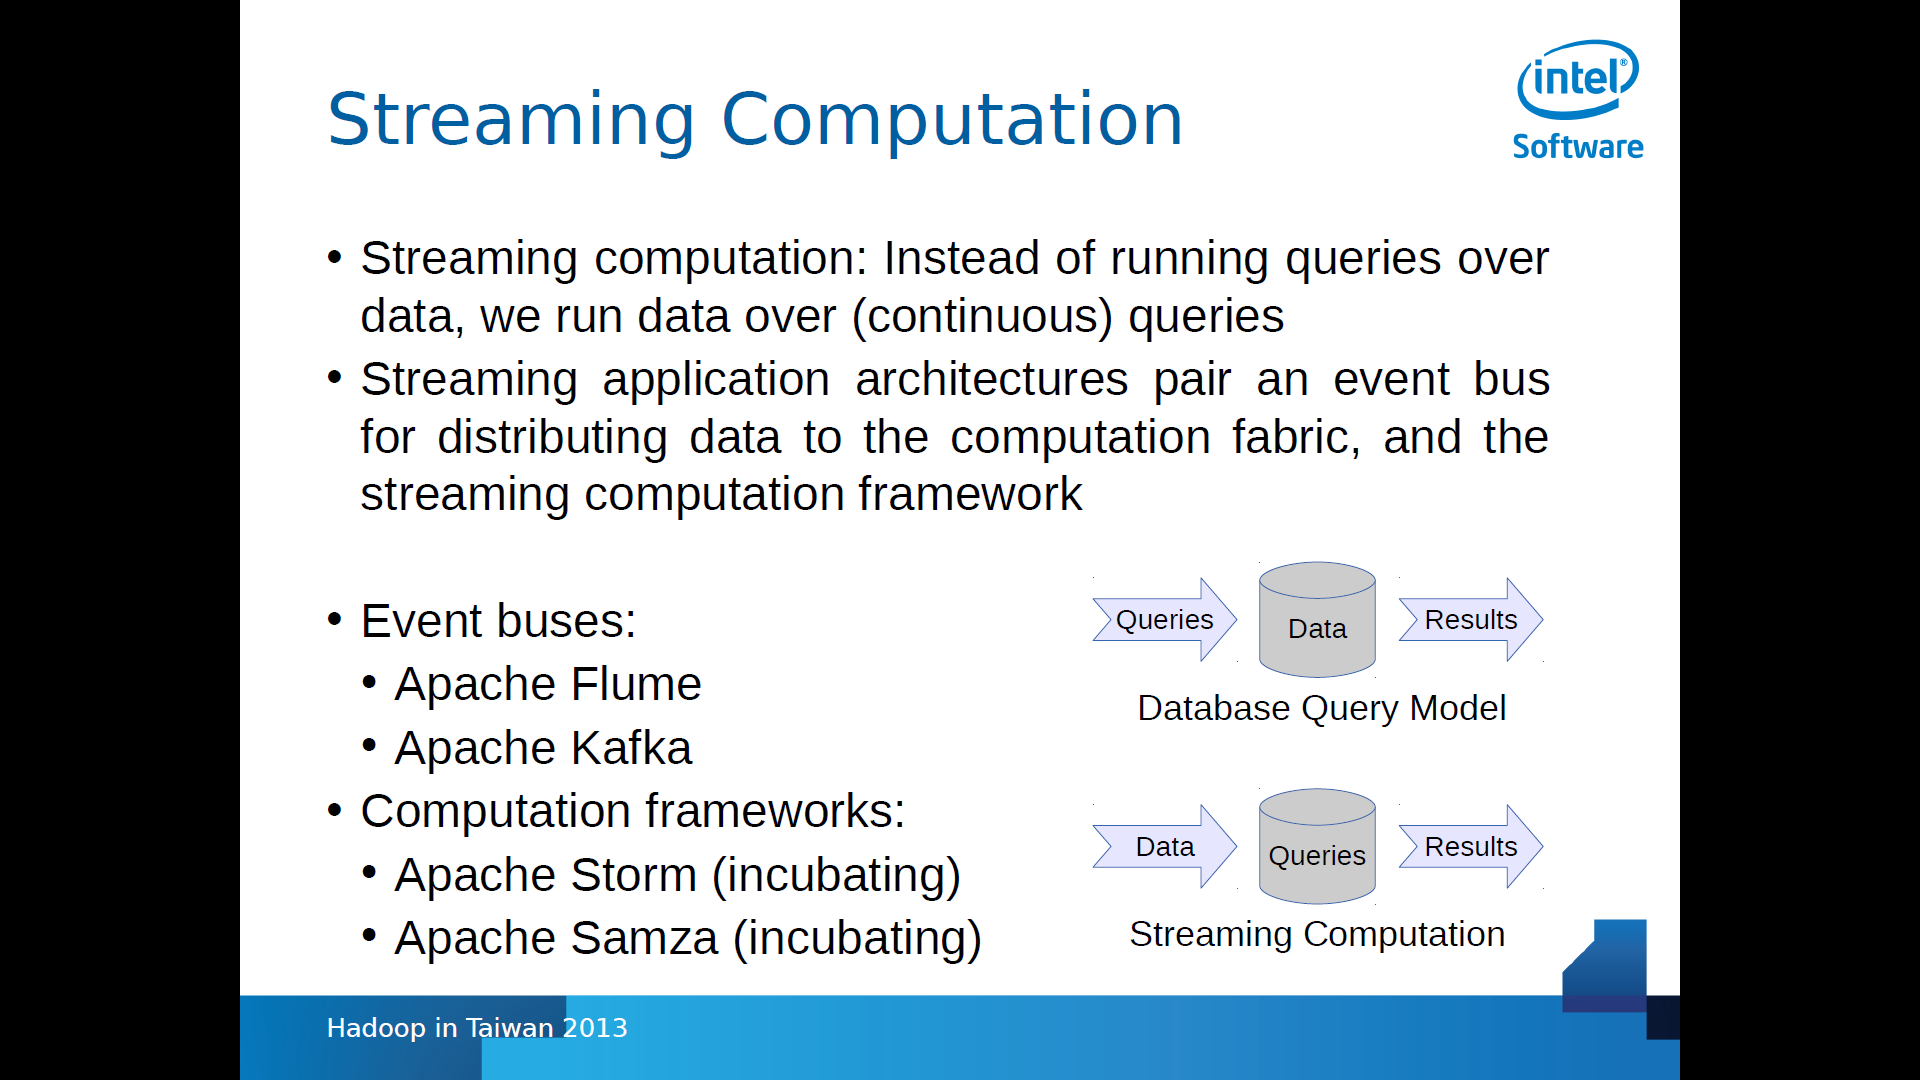
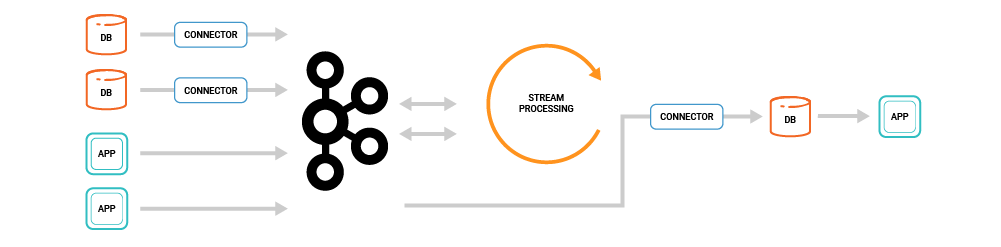
Our motivation in focusing on this is very simple: building applications around event streams has been too complex thus far. Consider this common stream processing application architecture:
This is quite complex as it involves a number of different distributed systems, all of which have to be integrated, secured, monitored, and operated as one. It’s a pretty heavy-weight stack for one application! However, one could be forgiven for preferring the simple three-tier architecture of traditional CRUD applications that only need a single database for serving all its data needs.
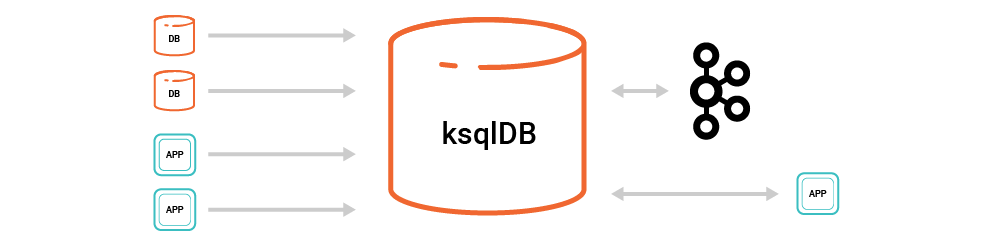
We want ksqlDB to provide the same simplicity for event streaming applications that relational databases provide for CRUD applications.
ksqlDB allows us to simplify this architecture substantially. Now, there are just two things: Kafka and ksqlDB, bringing together the full set of components needed from connectors, to processing, to queries.