Last active
October 9, 2023 22:29
-
-
Save davedele/6463534c905b1110d9e1e38cf67ab228 to your computer and use it in GitHub Desktop.
b1
This file contains hidden or bidirectional Unicode text that may be interpreted or compiled differently than what appears below. To review, open the file in an editor that reveals hidden Unicode characters.
Learn more about bidirectional Unicode characters
| createHorzChart(): void { | |
| const options: ApexCharts.ApexOptions = { | |
| chart: { id: this.chartUID || null, type: 'bar', height: 350 }, | |
| series: [ | |
| { | |
| name: this.seriesName, | |
| data: this.data?.map((item) => item?.value), | |
| label: this.data?.map((item) => item?.label) | |
| } | |
| ], | |
| states: { | |
| hover: { | |
| filter: { | |
| type: 'darken', | |
| value: 0.55, | |
| } | |
| } | |
| }, | |
| ...this.chartSettings, | |
| }; | |
| this.chart = new ApexCharts(this.barchart.nativeElement, options); | |
| this.chart.render(); | |
| } |
This file contains hidden or bidirectional Unicode text that may be interpreted or compiled differently than what appears below. To review, open the file in an editor that reveals hidden Unicode characters.
Learn more about bidirectional Unicode characters
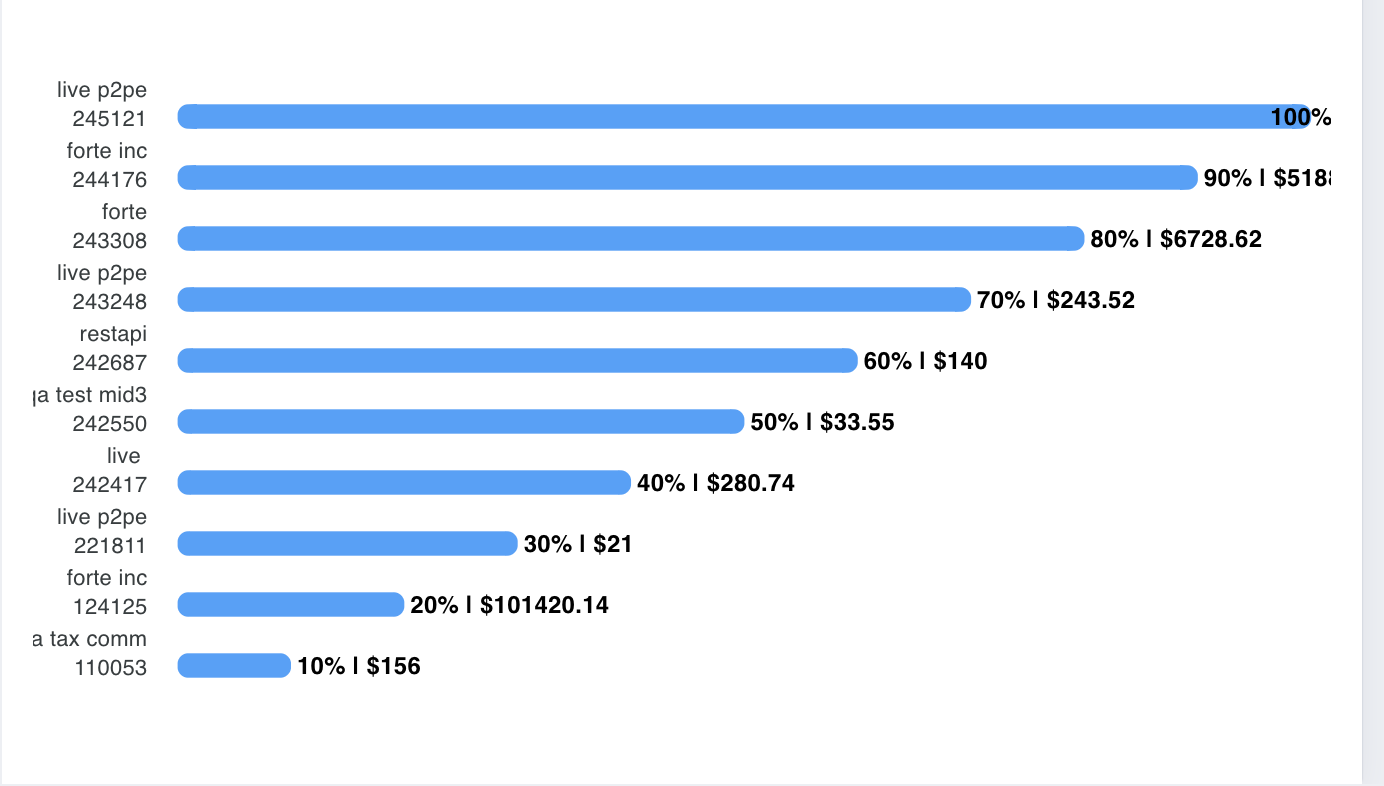
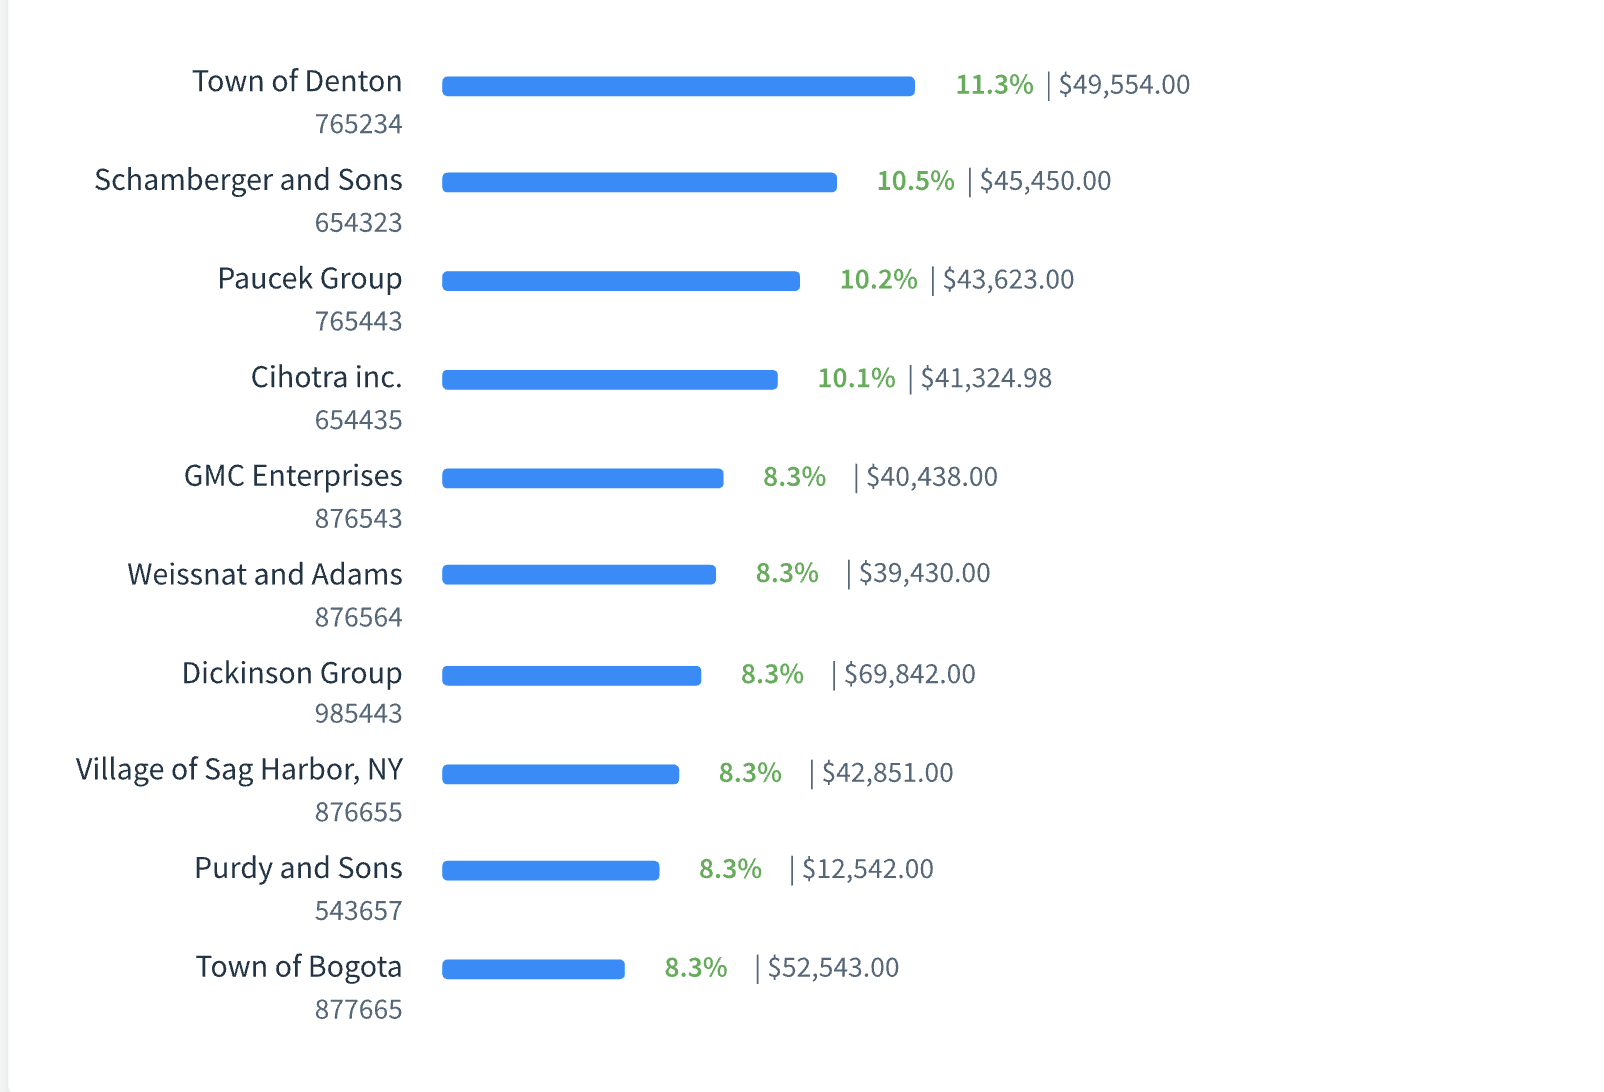
| getHighVolumeMerchantChartStyle() { | |
| return { | |
| chart: { height: 350, type: 'bar', toolbar: { show: false } }, | |
| plotOptions: { | |
| bar: { | |
| horizontal: true, | |
| dataLabels: { | |
| position: 'top' | |
| }, | |
| borderRadius: 5, | |
| columnWidth: '60%', // Adjust as needed | |
| barHeight: '50%', // Adjust as needed | |
| distributed: true | |
| }, | |
| }, | |
| grid: { | |
| show: true, | |
| borderColor: '#EAEAEA', // Update color as per mockup | |
| strokeDashArray: 4 | |
| }, | |
| xaxis: { | |
| tickAmount: 'dataPoints', | |
| tickPlacement: 'on', | |
| yAxisIndex: 0, | |
| axisTicks: { | |
| show: true | |
| }, | |
| labels: { | |
| show: true, | |
| style: { | |
| fontSize: '12px', | |
| colors: ['#A1A1A1'] // Update color as per mockup | |
| } | |
| }, | |
| axisBorder: { | |
| show: false | |
| } | |
| }, | |
| yaxis: { | |
| labels: { | |
| show: true, | |
| style: { | |
| fontSize: '14px', // Adjust as per mockup | |
| colors: ['#4A4A4A'] // Adjust as per mockup | |
| } | |
| } | |
| }, | |
| states: { | |
| hover: { | |
| filter: { | |
| type: 'darken', | |
| value: 0.55 | |
| } | |
| } | |
| }, | |
| dataLabels: { | |
| enabled: true, | |
| textAnchor: "start", | |
| offsetX: 10, | |
| style: { | |
| fontSize: "12px", | |
| colors: ["black"] | |
| }, | |
| formatter: function(val, opt) { | |
| const amount = opt.w.config.series[0].label[opt.dataPointIndex]; | |
| if (amount) { | |
| return `${val}% | $${amount}` | |
| } | |
| return val | |
| } | |
| }, | |
| tooltip: { | |
| y: { | |
| formatter: function (val, { series, seriesIndex, dataPointIndex, w }) { | |
| const amount = w.config.series[0].label[dataPointIndex]; | |
| return `Percentage:${val}%, Current Amount: $${amount}`; | |
| } | |
| } | |
| } | |
| }; | |
| } |
Author
davedele
commented
Oct 9, 2023
Author
Author

Sign up for free
to join this conversation on GitHub.
Already have an account?
Sign in to comment